ESPO
ANNUAL REPORT 2006-2007
6. The dry bulk market
6.1 Iron ore and coal production and seaborne dry bulk trades
As mentioned in the first chapter of this Market Report, a total volume 4.69 billion tons of dry cargo was shipped in 2005. This consisted of 1.70 billion tons of the five major bulks (iron ore, coal, grains, bauxite/alumina and rock phosphate), 950 million tons minor dry bulks and 2.04 billion tons other dry cargoes. The latter category mainly refers to containerized cargo and other general cargo, including RoRo.
According to Baffinland Iron Mines Corporation, world production of iron ore reached 1.26 billion tons in 2005, some 4.3% higher than the year before (Table 44). The top-five countries (Brazil, Australia, China, India and Russia) produced nearly 1 billion tons, giving them a combined market share of 79%. A similar picture applies to the export side, where the top-five countries (Australia, Brazil, India, Canada and South Africa) exported 600 million tons of iron ore in 2005, for a combined market share of 84%. Table 44 also illustrates that some 57% of worldwide iron ore production was exported in 2005. Countries such as Canada, Australia, Sweden, Brazil and South Africa put most of their iron ore production on the export market. On the other hand, China, the Ukraine, the United States and Russia used most (if not all) of their iron ore production for domestic purposes. The situation in India was rather balanced, with 55% of iron ore production exported and 45% used for domestic purposes. Baffinland Iron Mines Corporation forecasts a production volume of some 1.65 billion tons of iron ore for 2010.
Table 44: Production and exports of iron ore in 2005 (million tons)
|
Production |
m tons |
% |
Exports |
m tons |
% |
% of
prod. |
|
Brazil |
293 |
23% |
Australia |
239 |
34% |
91% |
|
Australia |
262 |
21% |
Brazil |
225 |
32% |
77% |
|
China |
198 |
16% |
India |
81% |
11% |
55% |
|
India |
146 |
12% |
Canada |
28 |
4% |
100% |
|
Russia |
97 |
8% |
South Africa |
27 |
4% |
68% |
|
Ukraine |
69 |
5% |
Russia |
20 |
3% |
21% |
|
United States |
55 |
4% |
Ukraine |
20 |
3% |
29% |
|
South Africa |
40 |
3% |
Sweden |
18 |
3% |
78% |
|
Canada |
28 |
2% |
United States |
12 |
2% |
22% |
|
Sweden |
23 |
2% |
China |
0 |
0% |
0% |
|
Others |
44 |
4% |
Others |
43 |
6% |
|
|
World total |
1,255 |
100% |
World total |
713 |
100% |
57% |
Source: Baffinland Iron Mines Corportation (2006)
The World Coal Institute estimates that global production of hard coal reached 4.97 billion tons in 2005, a 7.4% increase over the year before. The top-10 hard coal producers were China (2.23bn tons), the United States (951m tons), India (398m tons), Australia (301m tons), South Africa (240m tons), Russia (222m tons), Indonesia (140m tons), Poland (98m tons), Kazakhstan (79m tons) and Colombia (61m tons). Hence, these countries accounted for 95% of worldwide hard coal production in 2005. Worldwide consumption of hard coal reached 4.99 billion tons in 2005, of which 63% in the Asia-Pacific region, 19% in North America, 7% in Europe and 6% in the Former Soviet Union. Finally, the total brown coal/lignite production is estimated at 905 million tons in 2005. Major brown coal producers include Germany, the United States, Russia, Greece and Australia.
Tables 45, 46 and 47 depict the import-export matrices for the three main dry bulk categories in 2004, the most recent years for which this detailed information is available.
Table 45: Export-Import matrix for seaborne coal trade in 2004 (million tons)
|
From/to |
UK/Cont. |
Mediter. |
Other Eur. |
S.America |
Japan |
Other FE |
Others |
Total |
|
FSU/E.Europe |
26.1 |
18.6 |
10.2 |
0.3 |
9.3 |
7.1 |
1.9 |
73.6 |
|
North America |
12.9 |
5.8 |
4.6 |
8.2 |
10.2 |
9.2 |
3.5 |
54.5 |
|
Australia |
19.3 |
3.3 |
6.9 |
10.3 |
102.5 |
59.3 |
23.4 |
225.0 |
|
South Africa |
24.2 |
7.4 |
14.4 |
2.2 |
0.0 |
1.3 |
6.3 |
56.0 |
|
Others |
24.2 |
11.9 |
10.0 |
5.1 |
57.9 |
107.4 |
39.5 |
256.0 |
|
Total |
106.7 |
47.1 |
46.1 |
25.7 |
180.0 |
184.5 |
74.6 |
664.7 |
Source: Institute of Shipping Economics and Logistics (2006)
Table 46: Export-Import matrix for seaborne iron ore trade in 2004 (million tons)
|
From/to |
UK/Cont. |
Mediter. |
Other Eur. |
US |
Japan |
China |
Other FE |
Others |
Total |
|
Scandinavia |
6.6 |
0.8 |
0.9 |
0.0 |
0.0 |
0.7 |
0.2 |
6.7 |
15.8 |
|
Other Europe |
0.5 |
0.0 |
0.0 |
0.0 |
0.0 |
0.4 |
0.9 |
3.4 |
5.2 |
|
West Africa |
7.6 |
0.0 |
0.7 |
0.0 |
0.0 |
0.0 |
0.0 |
2.7 |
11.0 |
|
Other Africa |
7.2 |
0.3 |
3.2 |
0.0 |
10.1 |
17.0 |
1.6 |
2.3 |
41.7 |
|
North America |
12.0 |
1.3 |
0.3 |
0.0 |
0.9 |
1.9 |
2.3 |
4.5 |
23.2 |
|
S.America Atl. |
46.2 |
2.4 |
8.1 |
7.5 |
27.1 |
54.4 |
20.9 |
38.2 |
204.8 |
|
S.America Pac. |
0.0 |
0.0 |
0.0 |
0.4 |
4.1 |
5.7 |
3.0 |
0.6 |
13.8 |
|
Asia |
0.6 |
0.1 |
0.0 |
0.0 |
21.9 |
39.8 |
3.7 |
2.1 |
68.3 |
|
Australia |
14.6 |
1.0 |
0.5 |
0.1 |
76.3 |
69.6 |
38.8 |
5.2 |
206.1 |
|
Total |
95.3 |
5.9 |
13.7 |
8.0 |
140.4 |
189.6 |
71.3 |
65.7 |
589.8 |
Source: Institute of Shipping Economics and Logistics (2006)
Table 47: Export-Import matrix for seaborne grain trade in 2004 (million tons)
|
From/to |
US |
Canada |
S.America |
Australia |
Others |
Total |
|
UK/Continent |
2.8 |
0.7 |
6.0 |
0.0 |
0.3 |
9.8 |
|
Mediterranean |
4.0 |
1.7 |
6.1 |
0.7 |
3.5 |
16.0 |
|
East Europe |
0.6 |
0.0 |
0.6 |
0.0 |
3.5 |
4.8 |
|
Other Europe |
0.4 |
0.1 |
2.2 |
0.0 |
0.4 |
3.1 |
|
Africa |
14.6 |
2.2 |
7.4 |
3.8 |
12.0 |
40.1 |
|
Americas |
26.5 |
3.2 |
7.8 |
0.2 |
0.2 |
37.9 |
|
Near East |
3.6 |
0.0 |
1.0 |
0.1 |
2.9 |
7.6 |
|
Indian Ocean |
2.1 |
0.8 |
4.7 |
6.7 |
5.0 |
19.2 |
|
Japan |
22.8 |
1.7 |
0.8 |
2.7 |
0.7 |
28.6 |
|
Other Far East |
30.1 |
5.2 |
16.4 |
9.9 |
6.7 |
68.4 |
|
Not specified |
0.0 |
0.0 |
0.0 |
0.5 |
0.0 |
0.5 |
|
Total |
107.6 |
15.7 |
53.0 |
24.6 |
35.1 |
236.0 |
Source: Institute of Shipping Economics and Logistics (2006)
Table 48 provides an overview of the main dry cargo (all categories combined) loading and unloading areas in 2005. On the loading and unloading side, developed market-economy countries accounted for more than half of total trade.
Table 48: Loading and unloading areas for dry cargo in 2005
|
Area |
Loaded |
Unloaded |
Area |
Loaded |
Unloaded |
|
North America |
502.8 |
442.20 |
Caribbean. Central and North America |
65.3 |
86.1 |
|
Europe |
1,065.1 |
1,514.90 |
South America North and East |
392.6 |
91.7 |
|
Japan |
185.5 |
584.70 |
South America West |
119.9 |
34.6 |
|
Australia/New-Zealand |
604.4 |
47.90 |
Subtotal developing countries in America |
577.8 |
212.4 |
|
South Africa |
171.6 |
23.50 |
West Asia |
72.7 |
140.6 |
|
Subtotal DMECs |
2,529.4 |
2,613.2 |
South and East Asia |
761.7 |
914.9 |
|
Central and Eastern Europe |
181 |
67.4 |
Subtotal developing countries in Asia |
834.4 |
1,055.5 |
|
Socialist countries of Asia |
478.4 |
583.9 |
Developing Countries in Europe |
16.9 |
11.1 |
|
North Africa |
38 |
84.3 |
Developing Countries in Oceania |
2.1 |
5.5 |
|
West Africa |
19.6 |
42.1 |
Subtotal developing countries |
1,498.1 |
1,431.4 |
|
East Africa |
9.3 |
20.5 |
|
|
|
|
Subtotal developing countries in Africa |
66.9 |
146.9 |
World total |
4,686.9 |
4,695.9 |
Source: UNCTAD (2006)
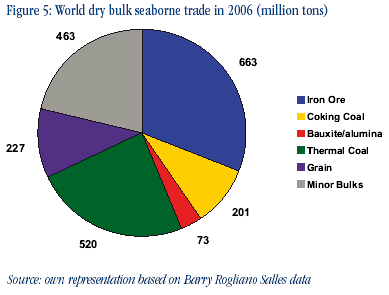
Finally, Figure 5 provides an overview of the dry bulk seaborne trade in 2006. Total trade amounted to some 2.15 billion tons, of which iron ore (31%), thermal coal (24%) and minor bulks (22%) represented the lion's share. Figure 5 also clearly illustrates the importance of the steel industry for dry bulk shipping: iron ore, coking coal and bauxite/alumina represented a combined volume of 937 million tons or nearly 44% of the total dry bulk seaborne trade in 2006. In addition, (semi-) finished steel products (which indeed classify as general cargo rather than dry bulk) represented a total volume of 218 million tons of seaborne trade in 2006.
According to the International Iron and Steel Institute, the production of crude steel reached an estimated 1.22 billion tons in 2006, an increase of some 8% compared to the year before. The top-10 crude steel producers were China (421m tons), Japan (116m tons), the United States (99m tons), Russia (71m tons), South Korea (48m tons), Germany (47m tons), India (43m tons), Ukraine (41m tons), Italy (32m tons) and Brazil (31m tons). Hence, these countries accounted for three quarters of worldwide crude steel production in 2006. Baffinland Iron Mines Corporation forecasts a further increase in world crude steel production to some 1.46 billion tons in 2010.
China is a particular case in point as far as crude steel is concerned. Until 2004 the country was a net importer of crude steel, but following massive increases in production in 2005 (+24.6%) and 2006 (+18.5%) the balance has shifted. According to French broker Barry Rogliano Salles, the gap between production and consumption of crude steel in China amounted to some 36 million tons in 2006 and it is expected to widen further to some 140 million tons in 2010. Having said this, however, Chinese consumption of crude steel is still very substantial. Of the estimated total world crude steel consumption of 1.13 billion tons in 2005, China accounted for 350m tons (31%), followed by the United States (113m tons), Japan (83m tons), South Korean (49m tons), India (41m tons) and Germany (39m tons). Hence, these six countries accounted for some 60% of world crude steel consumption in 2005.
6.2 Some key figures on the dry bulk fleet
Table 49 provides an overview of the dry bulk fleet for selected dates. At the first of July 2006 the total fleet reached 353.62m dwt, a 21.4% increase compared to the beginning of 2002. This is slightly lower than the 22.4% increase in the dwt capacity of the world merchant fleet over the period considered. As a result, the share of dry bulk vessel capacity in the world fleet marginally decreased from 36.4% at the beginning of 2002 to 36.1% at mid-2006.
Table 49: Overview of the dry bulk fleet for selected dates
| |
01-01-2002 |
|
01/07/2006 |
Growth |
|
| |
('000 dwt) |
% |
('000 dwt) |
% |
|
|
Bulk carriers |
277,067 |
95.2% |
346,412 |
98.0% |
25.0% |
|
Oil/bulk/ore carriers (OBO) |
14,108 |
4.8% |
7,211 |
2.0% |
-48.9% |
|
Total dry bulk fleet |
291,175 |
100% |
353,623 |
100% |
21.4% |
|
World merchant fleet |
799,763 |
978.522 |
22.4% |
|
|
Source: Institute of Shipping Economics and Logistics (2006)
Table 50 provides an overview of the dry bulk fleet divided by dwt range for 01/01/2006. As far as bulk carriers are concerned, nearly 65% of dwt capacity is provided by vessels in the 20,000-99,999 dwt range. Vessels above 100,000 dwt represent hardly 10% of the total number of ships, but they provide some 33% of the dwt capacity. Secondly, the oil/bulk/ore vessels are heavily concentrated in the 70,000-149,999 dwt range, with only two vessels being bigger than 200,000 dwt.
Table 50: Breakdown of the dry bulk fleet by dwt range (as at 01/01/2006)
| |
Bulk carriers |
Oil/bulk/ore carriers |
|
Dwt range |
ships |
'000 dwt |
% dwt |
ships |
'000 dwt |
% dwt |
|
0-9.999 |
877 |
2.883 |
0.9% |
47 |
156 |
1.9% |
|
0,000-9,999 |
499 |
7,858 |
2.4% |
3 |
43 |
0.5% |
|
20,000-49,999 |
2722 |
93,871 |
28.1% |
8 |
359 |
4.4% |
|
50,000-69,999 |
888 |
52,941 |
15.9% |
12 |
706 |
8.7% |
|
70,000-99,999 |
842 |
63,519 |
19.0% |
43 |
3,553 |
43.9% |
|
100,000-149,999 |
153 |
21,412 |
6.4% |
18 |
2,021 |
25.0% |
|
150,000-199,999 |
441 |
74,833 |
22.4% |
4 |
638 |
7.9% |
|
200,000-299,999 |
66 |
14,360 |
4.3% |
0 |
0 |
0.0% |
|
300,000-399,999 |
6 |
1,954 |
0.6% |
216 |
2 |
7.6% |
|
400,000+ |
0 |
0 |
0.0% |
0 |
0 |
0.0% |
|
Total dry bulk fleet |
6494 |
333,631 |
100% |
137 |
8.088 |
100% |
Source: Institute of Shipping Economics and Logistics (2006)
Finally, Table 51 provides an overview of the total dry bulk fleet (controlled and registered) by region. As this table indicates, more than 90% of the dry bulk fleet is controlled by owners in Asia/Oceania and Europe. On the other hand, just like was the case for the tanker fleet, the regional tonnage distribution according to the flag of registry shows a strong concentration on Latin and South America.
Table 51: World dry bulk fleet (controlled and registered) by region as at 01/01/2006 (percentages based on dwt)
| |
|
million |
Share |
| |
|
dwt |
|
|
Controlled
fleet |
Europe |
129.5 |
37.9% |
|
North America |
7.2 |
2.1% |
|
Latin and South America |
3.3 |
1.0% |
|
Asia and Oceania |
180.3 |
52.8% |
|
Africa |
0.9 |
0.3% |
|
Unknown |
20.1 |
5.9% |
| |
|
|
|
|
Registered
fleet |
Europe |
60.2 |
17.6% |
|
North America |
0.7 |
0.2% |
|
Latin and South America |
135.7 |
39.8% |
|
Asia and Oceania |
123.8 |
36.3% |
|
Africa |
20.8 |
6.1% |
| |
Total |
341.3 |
100% |
Source: Institute of Shipping Economics and Logistics (2006)
6.3 European shipping companies active in the dry bulk market
Table 52 provides a (non-exhaustive) overview of the main European shipping companies active in the dry bulk market. Just like with the liquid bulk market, the lion's share of these companies are located in Scandinavia, Germany and Greece. Moreover, quite a number of them are also active in the liquid bulk (LB) market.
Table 52: Main European shipping companies active in the dry bulk market
|
Country |
Shipping Company |
LB |
Country |
Shipping Company |
LB |
|
Denmark |
Norden |
X |
Spain |
Elcano |
X |
|
Denmark |
Lauritzen |
X |
France |
Louis Dreyfus Arm. |
|
|
Sweden |
Fredriksen group |
X |
France |
Setaf Saget |
|
|
Norway |
Western Bulk |
|
Germany |
Schulte group |
X |
|
Norway |
Eitzen Group |
X |
Germany |
E. Oldendorff |
X |
|
Norway |
KG Jebsen |
X |
Germany |
Orion Bulkers |
|
|
Norway |
Torvald Klaveness |
|
Germany |
Aug. Bolten |
|
|
Norway |
Grieg-Star Shipping |
|
Germany |
Peter Döhle |
|
|
Norway |
Spar Shipping |
|
Germany |
Vogemann |
|
|
UK |
Zodiac Maritime |
X |
Germany |
Poseidon Schiffahrt |
X |
|
UK |
Graig group |
|
Germany |
ASP Shipmgt |
X |
|
UK |
Nordbulk |
|
Greece |
Angelicoussis |
X |
|
Italy |
Coeclerici Ceres |
|
Greece |
Polembros |
X |
|
Italy |
Premuda |
X |
Greece |
Enterprises shipping |
|
|
Italy |
D'Amico Nav. |
X |
Greece |
Marmaras Nav. |
|
|
Italy |
Bottiglieri |
X |
Greece |
Golden Union |
|
|
Italy |
Fratelli d'Amato |
|
Greece |
Carras Hellas |
|
|
Belgium |
CMB |
|
|
|
|
6.4 Dry bulk cargo handled in European seaports
Table 53 provides an overview of dry bulk traffic handled in a selection of European seaports. The table was drawn from a large Eurostat database containing about 350 ports, handling a total throughput of 977 million tons of dry bulk in 2005. However, for the present Report we have limited ourselves to those seaports which handled at least 500,000 tons of dry bulk traffic. This resulted in a total ports sample of about 230 individual ports spread across 24 different countries. Their combined dry bulk throughput amounted to 944 million tons in 2005, effectively representing 97% of the total throughput of the 350 ports in the Eurostat database.
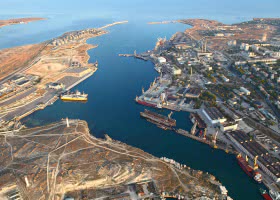
As can be seen from Table 53, the lion's share of this volume was handled in ports in the Netherlands, the United Kingdom, Spain, Italy and France. Between them, these five countries accounted for 564 million tons of dry bulk traffic in 2005. On an individual port basis, by far the biggest dry bulk port is Rotterdam, handling nearly 88 million tons of dry bulk traffic in 2005. This represents 9% of the combined dry bulk throughput of the 350 ports in the Eurostat database. Just as is the case for the liquid bulk market, Rotterdam owes its strong market position to its excellent nautical accessibility (it can receive dry bulk carriers of 300,000 dwt or more), coupled with very good links with major consumption centres in the hinterland (especially the German Ruhr area). Other major dry bulk ports, handling more than 25 million tons per year, include Hamburg (Germany), Antwerp (Belgium), Dunkirk (France), Taranto (Italy) and Amsterdam (Netherlands). Apart from these ports, 15 other ports handled between 10 and 25 million tons of dry bulk cargo in 2005. At the other end of the spectrum, more than 185 ports handled less than 1 million ton of dry bulk cargo.
Table 53: Overview of dry bulk handled in European seaports (2005)
|
Port |
tons |
Port |
tons |
|
Antwerp |
26,684,613 |
Vassilico Vassiliko) |
633,108 |
|
Ghent |
3,054,649 |
Other Cypriotic ports |
810,226 |
|
Zeebrugge |
1,718,655 |
Cyprus |
1,443,334 |
|
Oostende |
991,903 |
Riga |
14,938,364 |
|
Belgium |
42,449,820 |
Ventspils |
10,439,641 |
|
Varna |
7,373,893 |
Liepaja |
1,680,318 |
|
Burgas |
3,008,167 |
Latvia |
27,058,323 |
|
Bulgaria |
10,382,060 |
Klaipeda |
7,462,926 |
|
Enstedværkets Havn |
3,501,770 |
Lithuania |
7,462,926 |
|
Aalborg Portland |
2,906,083 |
Malta (Valetta) |
677,411 |
|
Århus |
2,852,271 |
Other Maltese ports |
2,262 |
|
Københavns Havn |
2,071,110 |
Malta |
679,673 |
|
Odense |
2,045,933 |
Rotterdam |
87,694,773 |
|
Asnæsværkets Havn |
1,273,502 |
Amsterdam |
25,107,777 |
|
Esbjerg |
1,081,997 |
Velsen/Ijmuiden |
18,666,451 |
|
Fredericia (Og Shell-Havnen) |
1,031,794 |
Vlissingen |
5,294,507 |
|
Aalborg |
956,893 |
Terneuzen |
3,742,709 |
|
Aabenraa |
917,038 |
Delfzijl/Eemshaven |
1,602,575 |
|
Kolding |
899,228 |
Dordrecht |
1,498,989 |
|
Rønne |
886,485 |
Moerdijk |
917,123 |
|
Randers |
883,130 |
Vlaardingen |
801,757 |
|
Køge |
848,680 |
Harlingen |
771,703 |
|
Studstrupværkets Havn |
784,281 |
Other Dutch ports |
128,114 |
|
Norjyllandsværkets Havn |
657,111 |
Netherlands |
146,226,478 |
|
Stigsnæsværkets Havn |
551,134 |
Gdansk |
9,273,949 |
|
Other Danish ports |
1,660,02 |
Swinoujscie |
6,666,268 |
|
Denmark |
25,808,461 |
Szczecin |
5,042,718 |
|
Hamburg |
27,011,709 |
Gdynia |
3,416,231 |
|
Bremen, Blumenthal |
6,450,257 |
Police |
2,086,060 |
|
Rostock |
6,070,366 |
Poland |
26,485,226 |
|
Bützfleth |
2,660,582 |
Sines |
5,801,572 |
|
Nordenham |
2,402,055 |
Lisboa |
5,203,093 |
|
Brake |
2,169,433 |
Setúbal |
3,224,270 |
|
Wilhelmshaven |
1,902,812 |
Leixões |
2,301,129 |
|
Wismar |
1,715,976 |
Aveiro |
1,416,233 |
|
Brunsbüttel |
1,100,480 |
Other Portuguese ports |
484,148 |
|
Lübeck |
969,895 |
Portugal |
18,430,445 |
|
Kiel |
739,202 |
Constanta |
18,103,190 |
|
Flensburg |
551,921 |
Other Romanian ports |
661,268 |
|
Other German ports |
1,195,886 |
Romania |
18,764,458 |
|
Germany |
54,940,574 |
Koper |
7,731,876 |
|
Tallinn |
6,975,427 |
Slovenia |
7,731,876 |
|
Other Estonian ports |
660,677 |
Raahe |
4,731,628 |
|
Estonia |
7,636,104 |
Kokkola |
2,709,032 |
|
Limerick |
9,140,956 |
Pori |
2,241,155 |
|
Dublin |
1,904,046 |
Kotka |
1,927,939 |
|
Cork |
1,572,570 |
Rauma |
1,517,683 |
|
Waterford |
804,438 |
Inkoo |
1,256,830 |
|
New Ross |
603,558 |
Koverhar |
1,129,189 |
|
Other Irish ports |
678,395 |
Helsinki |
959,823 |
|
Ireland |
14,703,963 |
Parainen |
886,985 |
|
Volos |
7,936,157 |
Naantali |
883,877 |
|
Larymna |
4,296,759 |
Uusikaupunki |
811,360 |
|
Thessaloniki |
3,395,929 |
Kemi |
772,516 |
|
Aliverio |
3,291,121 |
Pietarsaari |
730,546 |
|
Eleusina |
2,969,907 |
Other Finnish ports |
3,124,832 |
|
Milos Island |
2,889,663 |
Finland |
23,683,395 |
|
Almyros (Amaliapoli) Volou |
2,506,300 |
Luleå |
7,135,761 |
|
Chalkida |
1,628,890 |
Oxelösund (ports) |
4,211,861 |
|
Itea |
1,405,638 |
Karlshamn |
2,699,808 |
|
Antikyra |
1,296,946 |
Storugns |
2,503,999 |
|
Politika (074) |
1,205,320 |
Slite (ports) |
2,317,922 |
|
Rio |
1,134,524 |
Stockholm |
1,022,408 |
|
Kavala |
1,067,136 |
Köping |
991,615 |
|
Heraklio |
824,489 |
Skellefteå |
989,047 |
|
Nafplio |
657,636 |
Norrköping |
873,247 |
|
Igoumenitsa |
652,925 |
Halmstad |
812,336 |
|
Other Greek ports |
947,947 |
Västerås |
721,196 |
|
Greece |
38,107,287 |
Malmö |
597,861 |
|
Gijón |
19,663,187 |
Uddevalla |
571,599 |
|
Tarragona |
11,915,749 |
Helsingborg |
500,756 |
|
Ferrol |
8,289,625 |
Other Swedish ports |
1,801,779 |
|
Huelva |
7,530,686 |
Sweden |
27,751,195 |
|
Valencia |
6,360,690 |
Immingham |
20,735,227 |
|
Almería |
6,306,756 |
London |
15,002,694 |
|
Santander |
5,139,651 |
Tees & Hartlepool |
12,401,973 |
|
Cartagena |
5,027,915 |
Clydeport |
11,281,993 |
|
La Coruña |
4,437,796 |
Liverpool |
8,891,227 |
|
Bilbao |
4,261,135 |
Port Talbot |
8,569,720 |
|
Barcelona |
3,532,003 |
Bristol |
6,415,974 |
|
Castellón |
3,293,592 |
Medway |
5,471,213 |
|
Pasajes |
3,273,904 |
Glensanda |
5,438,705 |
|
Avilés |
3,082,737 |
Hull |
3,784,965 |
|
Sevilla |
2,813,380 |
Belfast |
3,444,407 |
|
Algeciras |
2,652,267 |
Southampton |
2,234,526 |
|
Cádiz |
2,557,444 |
Newport, Gwent |
2,072,789 |
|
Palma Mallorca |
2,389,763 |
Tyne |
1,920,976 |
|
Málaga |
2,100,472 |
Ipswich |
1,817,462 |
|
Santa Cruz de Tenerife |
1,892,082 |
Manchester |
1,658,800 |
|
Las Palmas |
1,785,378 |
Forth |
1,650,822 |
|
Alicante |
1,667,539 |
Shoreham |
1,382,108 |
|
Molina de Segura |
1,234,823 |
Fowey |
1,270,154 |
|
Marín-Pontevedra |
1,016,240 |
River Hull & Humber |
983,447 |
|
Vigo |
692,535 |
Ballylumford |
976,836 |
|
Villagarcía (de Arosa) |
578,413 |
Trent River |
861,106 |
|
Other Spanish ports |
155,656 |
Plymouth |
832,969 |
|
Spain |
113,651,418 |
Newhaven |
659,216 |
|
Dunkerque |
26,314,341 |
Londonderry |
655,932 |
|
Marseille |
15,363,075 |
Other UK ports |
5,046,796 |
|
Nantes Saint-Nazaire |
8,348,756 |
United Kingdom |
125,462,037 |
|
Rouen |
8,040,885 |
Bakar |
2,242,427 |
|
Le Havre |
4,848,293 |
Ploce |
2,196,708 |
|
La Rochelle |
3,266,933 |
Split |
1,362,296 |
|
Bordeaux |
2,648,341 |
Pula |
807,247 |
|
Sète |
1,768,116 |
Rabac |
726,424 |
|
Bayonne |
1,569,330 |
Rijeka |
512,835 |
|
Lorient |
1,455,032 |
Other Croatian ports |
1,190 |
|
Port Réunion (ex Pointe-des-Galets) |
1,290,686 |
Croatia |
7,849,127 |
|
Brest |
1,041,243 |
Narvik |
15,921,615 |
|
Calais |
827,004 |
Porsgrunn Ports |
5,589,901 |
|
Port-la-Nouvelle |
749,859 |
Bergen Ports |
2,575,692 |
|
Guadeloupe (Guadeloupe) |
723,138 |
Haugesund Ports |
2,554,026 |
|
Caen |
592,521 |
Brønnøy |
1,931,784 |
|
Other French ports |
1,132,204 |
Kristiansund N/Grip |
1,852,343 |
|
France |
79,979,757 |
Mo i Rana/Rana |
1,798,880 |
|
Taranto |
25,453,936 |
Oslo |
1,329,626 |
|
Ravenna |
12,962,076 |
Fredrikstad/Sarpsborg |
1,281,702 |
|
Venezia |
11,224,317 |
Stavanger Ports |
1,248,499 |
|
Brindisi |
6,339,720 |
Drammen Ports |
1,044,766 |
|
Portovesme |
4,514,519 |
Verdal/Levanger |
793,962 |
|
Savona-Vado |
4,467,391 |
Trondheim/Flakk |
685,347 |
|
Piombino |
4,375,254 |
Kristiansand S |
586,807 |
|
Genova |
3,551,330 |
Moss |
571,880 |
|
Porto Torres |
2,179,487 |
Other Norwegian ports |
11,244,799 |
|
Trieste |
2,130,276 |
Norway |
51,011,629 |
|
La Spezia |
1,853,761 |
|
|
|
Ancona |
1,548,162 |
|
|
|
Chioggia |
1,537,450 |
Total all ports |
977,021,358 |
|
Oristano |
1,502,718 |
|
|
|
Bari |
1,258,013 |
|
|
|
Livorno |
1,235,020 |
|
|
|
Monfalcone |
1,060,197 |
|
|
|
Napoli |
1,036,517 |
|
|
|
Civitavecchia |
1,025,408 |
|
|
|
Marina Di Carrara |
1,015,161 |
|
|
|
Porto Empedocle |
936,783 |
|
|
|
Augusta |
896,868 |
|
|
|
Pozzallo |
853,816 |
|
|
|
Manfredonia |
811,342 |
|
|
|
Barletta |
801,491 |
|
|
|
Salerno |
761,102 |
|
|
|
Gaeta |
604,005 |
|
|
|
Porto Nogaro |
500,279 |
|
|
|
Other Italian ports |
2,885,393 |
|
|
|
Italy |
99,321,792 |
|
|
Source: Eurostat
Overview of main developments in the European dry bulk market during 2006
Development of the bulk carrier fleet in 2006
According to Clarkson Research Services Ltd, the world bulk carrier fleet counted 6369 units at the end of 2006, for a combined capacity of 367.9 million dwt. This represents an increase of some 7% compared to the year before. At the end of 2006 worldwide orderbooks counted no less than 1138 bulk carriers (of which 354 to be delivered in 2007) for a combined capacity of 89.42 million dwt. This is some 24% of the bulk carrier fleet capacity at the end of 2006. Finally, 49 bulk carriers were sent to the scrapyards in 2006, for a combined 1.87 million dwt capacity.
Port/terminal development in Europe (non-exhaustive)
A new facility at OBA Bulk Terminal Amsterdam, one of Europe's largest bulk terminals, consisting of a 365m quay and a 10 ha storage and handling area, opened in October 2006. This will give the terminal an annual throughput capacity of 4m tons. Further development will include two Capesize quays and an additional 20-25ha of storage area. This year, LBH is going to build an indented berth, 400m long and 80m wide, for barges. When these projects are completed, Amsterdam's coal handling facilities will have been expanded from 85ha to 115ha.
The Port of Immingham's '59.5 m dedicated coal-handling facility, Humber International Terminal 2 (HIT 2), was officially opened in May 2006. HIT 2 is located close to six of Britain's largest power stations. It was developed to meet the power-generation industry's escalating demand for coal. The terminal can handle an estimated 9.5m tons of coal each year. In August 2006 the facility handled a record-breaking total of 1.095m tons, of which 1.022m tons was coal. HIT 2 extends Humber International Terminal's total quay length by 220m, giving a total of 520m, and can accommodate vessels carrying more than 100,000 tons of cargo.
In August 2006, Associated British Ports (ABP) announced to invest '3.7m in two new Gottwald cranes for Humber International Terminal 1, the dedicated dry bulk handling terminal at the port of Immingham.
Following the signing of a new 20-year agreement with Solent Stevedores, ABP is investing '4.1m in upgrading the handling and storage facilities at Southampton's Bulk Terminal. The investment comprises '1.6m earmarked for a new mobile harbour crane, and '2.5m for a new multi-purpose transit shed, which will be completed in 2007. ABP has also invested over '700,000 on upgrading the handling equipment in Ayr.
In addition to ABP's investment, Solent Stevedores has spent approximately '350,000 on shore-side equipment in the port of Southampton in 2006, with additional investments of '250,000 planned for 2007 and 2008. A new high-capacity screw-type ship unloader has been commissioned at the Seaforth Grain Terminal, which enables bulk carriers of up to 75,000dwt to be discharged at the terminal with unloading capacities of up to 1,800 tons per hour.
Workington, the largest port in Cumbria, has invested over '8m in the latest phase of developments at Battleship Wharf with new carnage already in place capable of discharging over 10,000 tons of cargo per day. The port opened a new rail link in September in 2006 with a quay extension due for completion by the end of the year. The port is investing approximately '7.8m in the upgrade of its main bulk terminal, Battleship Wharf. It is to construct a 155m quay extension, build a rail link, improve site infrastructure and upgrade support vehicles. This is in addition to the new 100 ton capacity harbour crane that was purchased earlier 2006. This is the biggest investment by the port in decades and has been implemented to cope with the increasing bulk trades being handled at the port.
ABP's port of Teignmouth took an important step forward when the Western Quays was officially opened during August 2006. The Western Quays is the product of a '5m investment by ABP and represents a huge enhancement of the port's cargo-handling facilities.
A number of new developments were completed at Dunkirk's multibulk facilities in the central area of the port. The Vracs du Nord cement terminal that exports ground slag produced by the new crushing plant of Ciment des Flandres, and the Dunkerque Multibulk Terminal, which has facilities for handling and storing under cover of powdered bulk products, were both completed in 2006.
Other significant developments (non-exhaustive)
The containerization of bulks is a rapidly developing sector. As an example, it has now become cheaper to move barley and other grains in containers to Asia than using Panamax Bulk carriers. Port logistics and terminal operator Société Havraise de Gestion et de Transport (SHGT) has recently invested ' 2m in developing a system to put sugar in containers in the port of Le Havre.
Despite being a relative newcomer on the dry bulk market, "K" Line (Europe) already established several contracts, both long and short term, with major European steel mills, trading houses and power companies worldwide. A new Capesize vessel of 185,500 dwt was to be delivered in the first half of 2006.
In early 2007 Navios Maritime Holdings (Greece) took over Kleimar, the dry bulk shipping company of Belgium's Sea-Invest group, for a reported '128 million. The Kleimar fleet, specialized for the transport of coal and iron ore, comprises 30 vessels of which 20 Capesizes and 10 Panamaxes. In 2005 Kleimar transported some 27 million tons of dry bulk cargo. Sea-Invest is one of the largest (if not the largest) bulk handling companies in Europe, active in the handling and storage of such commodities as iron ore, coal, fertilizers and liquid bulk. It is also a major player on the European fruit handling scene.
Source: International Bulk Journal and various trade press articles |
BACK TO INDEX
|