Il bilancio del primo semestre 2001 del gruppo britannico P&O, il primo a non riportare i risultati della divisione crocieristica, da cui si è separato lo scorso anno (inforMARE del 23 ottobre 2000), mostra un giro d'affari di 1.125,5 milioni di sterline (oltre 3 miliardi di dollari), con un incremento del 5,7% rispetto alla prima metà dello scorso anno. L'utile operativo è stato di 135,7 milioni di sterline (-8,7%) e l'utile ante imposte di 90,4 milioni di sterline (-6,4%). Il bilancio del primo semestre 2001 del gruppo britannico P&O, il primo a non riportare i risultati della divisione crocieristica, da cui si è separato lo scorso anno (inforMARE del 23 ottobre 2000), mostra un giro d'affari di 1.125,5 milioni di sterline (oltre 3 miliardi di dollari), con un incremento del 5,7% rispetto alla prima metà dello scorso anno. L'utile operativo è stato di 135,7 milioni di sterline (-8,7%) e l'utile ante imposte di 90,4 milioni di sterline (-6,4%).
«Nonostante il rallentato tasso di crescita del commercio mondiale - ha detto oggi il presidente del gruppo, Lord Sterling - le nostre attività portuali e logistiche hanno mostrato una notevole capacità di recupero, e siamo fiduciosi che continueranno a far bene. Il settore ferries e la P&O Nedlloyd stanno facendo fronte ad una situazione molto più competitiva, ma sono leader del mercato che possono giocare un ruolo chiave in un ulteriore consolidamento dell'industria».
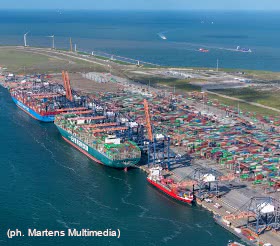
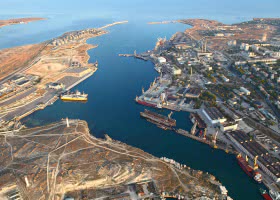
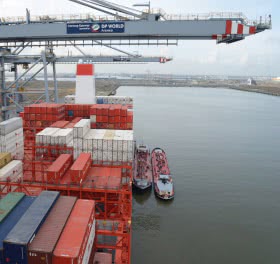
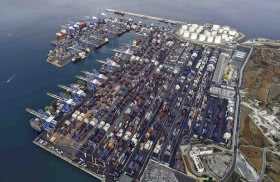
Il settore portuale e quello logistico hanno registrato un incremento complessivo del 35% dell'utile operativo, che è salito a 68,1 milioni di sterline. L'utile operativo del solo settore portuale, in cui opera la società terminalista P&O Ports (inforMARE del 18 luglio 2001), è risultato di 59,9 milioni di sterline, contro 40,3 milioni nel primo semestre dello scorso anno. In merito all'aggiudicazione del container terminal di Chennai alla P&O Ports (inforMARE del 9 agosto 2001), il gruppo britannico ha specificato che la società terminalista si insedierà nel porto indiano dalla metà del prossimo novembre.
L'utile operativo della filiale P&O Maritime è ammontato a 6,7 milioni di sterline (+26%), mentre quelli della Cold Logistics e della P&O Trans European sono risultati rispettivamente di 8,8 milioni (+42%) e 6,4 milioni di sterline (+60%).
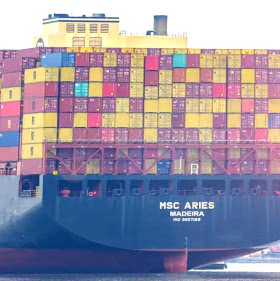
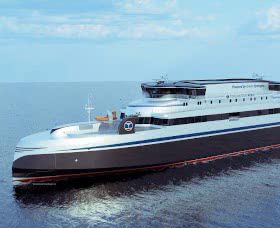
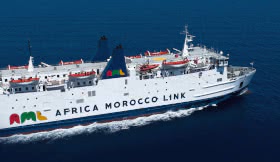
L'utile operativo della compagnia di navigazione P&O Nedlloyd è risultato in crescita di circa il 150% (inforMARE del 16 agosto 2001). Il comparto ferries ha invece riportato un passivo operativo di 18,1 milioni di sterline, contro un passivo di 7,4 milioni nel primo semestre del 2000.
The Peninsular and Oriental Steam Navigation Company (P&O)
Interim Results
(Source: P&O)
| Financial highlights | |
|
| | Six months to
30 June 2001 | Six months to
30 June 2000* |
| | £m | £m |
| Turnover | 2,125.5 | 2,010.0 |
| Operating profit | 135.7 |
148.6 |
| Net interest | (55.5) | (51.9) |
| Profit before tax | 90.4 |
96.6 |
| Profit attributable to stockholders | 62.1 | 64.3 |
| Basic earnings per share | 8.9p | 9.3p |
| Dividend per share | 4.5p |
n/a |
|
* Pro forma, excluding the results of the cruises business which was demerged on 23 October 2000.
|
GROUP PROFIT AND LOSS ACCOUNT EXCLUDING CRUISES
FOR THE SIX MONTHS ENDED 30 JUNE 2001 |
| | Actual six months to 30 June 2001 | Pro forma six months to 30 June 2000 | Pro forma year to 31 Dec 2000 |
| | £m | £m | £m |
| Turnover: Group and share of joint ventures | 2,125.5 | 2,010.0 | 4,393.5 |
| Less: share of joint ventures' turnover |
(897.0) | (769.6) | (1,830.5) |
| | ____ | ____ | ____ |
| Group turnover (note 2) | 1,228.5 | 1,240.4 | 2,563.0 |
| Net operating costs | (1,146.1) | (1,120.0) | (2,318.4) |
| | ______ | ______ | ______ |
| Group operating profit | 82.4 | 120.4 | 244.6 |
| Share of operating results of: joint ventures | 39.8 | 21.8 | 110.4 |
| associates | 13.5 | 6.4 | 10.3 |
| | ______ | ______ | ______ |
| Total operating profit (note 3) | 135.7 | 148.6 | 365.3 |
| Profit/(loss) on sale of properties held as fixed assets | - | 0.2 | (17.1) |
| Profit/(loss) on sale of other fixed assets and businesses | 10.2 | (0.3) | (89.3) |
| | ______ | ______ | ______ |
| Profit on ordinary activities before interest | 145.9 | 148.5 | 258.9 |
| Net interest and similar items (note 5) |
(55.5) | (51.9) | (96.2) |
| | ______ | ______ | ______ |
| Profit on ordinary activities before taxation | 90.4 | 96.6 | 162.7 |
| Taxation (note 6) | (23.3) |
(25.9) | (83.7) |
| | ______ | ______ | ______ |
| Profit on ordinary activities after taxation | 67.1 | 70.7 | 79.0 |
| Equity minority interests | (5.0) | (6.4) | (14.1) |
| | ______ | ______ | ______ |
| Profit for the period attributable to stockholders | 62.1 | 64.3 | 64.9 |
| Dividends on equity and non-equity share capital | (32.3) | (93.6) | (157.3) |
| | ______ | ______ | ______ |
| Retained profit/(loss) for the period | 29.8 | (29.3) | (92.4) |
| | ______ | ______ | ______ |
Basic earnings per £1 nominal of deferred stock
| 8.9p | 9.3p | 9.1p |
| Dividends per £1 nominal of deferred stock | 4.5p | n/a | n/a |
SUMMARISED GROUP BALANCE SHEET EXCLUDING CRUISES
AS AT 30 JUNE 2001 |
| | Actual
30 June
2001
| Pro forma
30 June
2000
|
Actual
31 Dec
2000
|
| | £m | £m | £m
|
| Goodwill | 193.3 | 156.0 | 171.3 |
| Ships | 216.4 | 458.5 | 197.5 |
| Properties | 504.8 | 474.1 | 484.4 |
| Other fixed assets | 644.8 |
585.6 | 598.7 |
| Investments | 1,120.6 | 954.1 | 1,062.1 |
| Development and dealing properties | 381.6 | 336.3 | 367.1 |
| Stocks | 52.9 | 55.8 | 61.8 |
| Debtors | 741.3 | 833.2 | 811.3 |
| | ______ | ______ | ______ |
| | 3,855.7 | 3,853.6 | 3,754.2
|
| Net borrowings (note 7) | (1,124.2) | (913.0) | (1,025.4) |
| Other creditors and provisions | (924.0) | (1,157.3) | (994.9) |
| Equity minority interests | (73.3) | (81.3) | (71.1) |
| | ______ | ______ | ______ |
| Net assets less equity minority interests |
1,734.2 | 1,702.0 | 1,662.8 |
| | ______ | ______ | ______ |
| Stockholders' funds | 1,734.2 | 1,702.0 | 1,662.8 |
SUMMARISED GROUP CASH FLOW STATEMENT EXCLUDING CRUISES
FOR THE SIX MONTHS ENDED 30 JUNE 2001 |
| | Actual | Pro forma | Pro forma |
| | six months | six months | year to |
| | to 30 June | to 30 June | 31 Dec |
| | 2001 | 2000 | 2000 |
| | £m | £m | £m |
| Net cash inflow from operating activities and | | | |
| dividends from joint ventures and associates | 131.9 | 186.8 | 394.8 |
| Returns on investments and servicing of finance | (31.2) | (32.2) | (58.2) |
| Taxation paid | (21.7) |
(16.4) | (44.3) |
| | ______ | ______ | ______ |
| | 79.0 | 138.2 | 292.3 |
| | | |
|
| Purchase of fixed assets and investments |
(183.1) | (135.5) | (250.2) |
| Sale of fixed assets and investments | 90.0 | 527.9 | 640.5 |
| Purchase of subsidiaries, joint ventures and associates | (45.9) | (49.6) | (188.4) |
| Sale of subsidiaries, joint ventures and associates | 88.6 | 61.2 | 98.0 |
| | ______ | ______ | ______ |
| | 28.6 | 542.2 | 592.2 |
| | | |
|
| Equity dividends paid | (61.1) | (130.3) | (222.4) |
| | ______ | ______ | ______ |
Net cash (outflow)/inflow before management
of liquid resources and financing | (32.5) | 411.9 | 369.8 |
| | ______ | ______ | ______ |
| | | |
|
| Movement in net borrowings |
| | |
Net cash (outflow)/inflow before management
of liquid resources and financing | (32.5) | 411.9 | 369.8 |
| Issues of stock | 1.3 | 4.1 | 13.7 |
| Borrowings of subsidiaries (acquired) less sold | (8.9) | (319.8) | (180.3) |
Inception of finance leases and
other non-cash movements in net borrowings | (29.9) | (0.9) | (39.4) |
| Net investment in P&O Princess Cruises |
- | (19.4) | (197.5) |
| Exchange movements in net borrowings | (28.8) | (45.2) | (48.0) |
| | ______ | ______ | ______ |
| (Increase)/decrease in net borrowings | (98.8) | 30.7 | (81.7) |
| | ______ | ______ | ______ |
| Group turnover | Actual |
Pro forma | Pro forma |
| | six months | six months | year to |
| | to 30 June | to 30 June | 31 Dec |
| | 2001 | 2000 | 2000 |
| | £m | £m | £m |
| | | |
|
| Ports | 310.3 | 233.7 | 531.6 |
| Logistics | |
| |
| Cold Logistics | 65.3 | 49.3 | 105.8 |
| Contract Logistics | 366.2 |
321.5 | 668.7 |
| Unit Loads | 167.6 | 156.1 | 322.3 |
| Ferries | 209.3 | 197.5 | 433.4 |
| Bulk shipping | - | 32.5 | 103.5 |
| Property | 109.8 | 249.8 | 397.7 |
| | ______ | ______ | ______ |
| | 1,228.5 | 1,240.4 | 2,563.0 |
| | ______ | ______ | ______ |
|
Certain small service companies, included within Logistics to 30 June 2000, are now included within Property.
|
| Total operating profit | Actual | Pro forma | Pro forma |
| | six months | six months | year to |
| | to 30 June | to 30 June | 31 Dec |
| | 2001 | 2000 | 2000 |
| | £m | £m | £m |
| | | |
|
| Ports | 52.9 | 40.3 | 102.5 |
| Logistics | |
| |
| Cold Logistics | 8.8 | 6.2 | 13.9 |
| Contract Logistics | 6.6 |
4.8 | 12.9 |
| Unit Loads | (0.2) | (0.8) | (2.0) |
| Ferries | (18.1) | (7.4) | 20.1 |
| P&O Nedlloyd | 23.8 |
9.7 | 66.2 |
| Bulk shipping | 7.4 | 3.5 | 17.8 |
| Property | 54.5 | 92.3 | 133.9 |
| | ______ | ______ | ______ |
| | 135.7 | 148.6 | 365.3 |
| | ______ | ______ | ______ |
| Net operating assets | Actual | Pro forma | Actual |
| | 30 June | 30 June | 31 Dec |
| | 2001 | 2000 | 2000 |
| | £m | £m | £m |
| | | |
|
| Ports | 946.3 | 818.1 | 857.7 |
| Logistics | |
| |
| Cold Logistics | 178.1 |
128.7 | 160.0 |
| Contract Logistics | 148.7 |
128.4 | 127.9 |
| Unit Loads | 58.5 | 84.0 | 58.4 |
| Ferries | 454.1 | 417.7 | 432.8 |
| P&O Nedlloyd | 839.2 |
739.3 | 760.8 |
| Bulk Shipping | 162.4 | 338.0 | 216.8 |
| Property | 877.6 | 914.4 | 888.0 |
| | ______ | ______ | ______ |
| | 3,664.9 | 3,568.6 | 3,502.4 |
| Net interest and similar items | Actual | Pro forma | Pro forma |
| | six months | six months | year to |
| | to 30 June | to 30 June | 31 Dec |
| | 2001 | 2000 | 2000 |
| | £m | £m | £m |
| | | |
|
| Group | (38.7) | (37.4) | (79.0) |
| Joint ventures | (12.2) |
(13.8) | (14.9) |
| Associates | (4.6) | (0.7) | (2.3) |
| | ______ | ______ | ______ |
| | (55.5) | (51.9) | (96.2) |
|
|