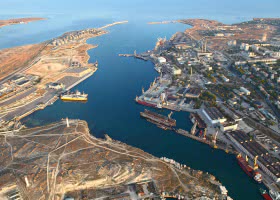
Lo scorso anno il porto di Calais ha movimentato 34.380.154 tonnellate di merci, con una progressione del 5% rispetto al 2001. Nel settore passeggeri è stato registrato un traffico di 14.990.931 unità, con un aumento del 4,32%. Sono risultati in crescita anche i traffici di autovetture al seguito dei passeggeri (+3,87%) e di camion imbarcati sui servizi traghetto che partono dallo scalo francese (+5,46%).
Port of Calais Lo scorso anno il porto di Calais ha movimentato 34.380.154 tonnellate di merci, con una progressione del 5% rispetto al 2001. Nel settore passeggeri è stato registrato un traffico di 14.990.931 unità, con un aumento del 4,32%. Sono risultati in crescita anche i traffici di autovetture al seguito dei passeggeri (+3,87%) e di camion imbarcati sui servizi traghetto che partono dallo scalo francese (+5,46%).
Port of Calais
Statistics 2002
(Source: Port of Calais)
Passenger and vehicle traffic
(Arrivals and departures combined)
| | | DECEMBER
| JANUARY to DECEMBER
|
| | | 2002
| 2001 |
02/01 |
2002
| 2001 |
02/01 |
| Passengers
| | | | | | |
| | car ferries
| 1,002,891
| 1,074,841
| -6,70% |
13,702,588 |
13,571,693 |
+0,96% |
| | high speed ferries
| | | | | | |
| | catamarans
| 85,832 |
96,571 | -11,13%
| 1,286,554
| 794,680 |
+61,89% |
| | cruise ships
| | | | 1,789
| 3,189 |
-43,91% |
| Total number of passengers
| 1,088,723
| 1,171,412
| -7,06% |
14,990,931 |
14,369,562 |
+4,32% |
| | | | | | | | |
| Tourist vehicles
| | | | | | |
| | car ferries
| 168,958 |
192,752 | -12,35%
| 2,261,114
| 2,308,971
| -2,08% |
| | high speed ferries
| | | | | | |
| | catamarans
| 23,635 |
26,124 | -9,53%
| 349,071 |
203,770 | +71,30%
|
| Total number of vehicles
| 192,593 |
218,876 | -12,01%
| 2,610,185
| 2,512,741
| +3,87% |
| | | | | | | | |
| Lorries
| | | | | | |
| | car ferries
| 105,399 |
99,785 | +5,62%
| 1,448,646
| 1,373,540
| +5,46% |
| | high speed ferries
| | | | | | |
| | catamarans
| 17 | 57
| -70,18% |
347 | 423
| -17,97% |
| Total number of lorries
| 105,416 |
99,842 | +5,58%
| 1,448,993
| 1,373,963
| +5,46% |
| | | | | | | | |
| Number of movements
| | | | | | |
| | car ferries
| 3,027 |
2,778 | +8,96%
| 38,799 |
39,138 | -0,87%
|
| | high speed ferries
| | | | | | |
| | catamarans
| 468 | 482
| -2,91% |
6,916 | 3,842
| +80,01% |
| Total number of movements
| 3,495 |
3,260 | +7,20%
| 45,715 |
42,980 | +6,36%
|
Traffic in merchandise
(Arrivals and departures breakdown)
| | | DECEMBER
| JANUARY to DECEMBER
|
| | | 2002
| 2001 |
02/01 |
2002
| 2001 |
02/01 |
Diversified
merchandise
| arrive |
1,032,430 |
973,660 | +6,03%
| 14,193,110
| 13,537,220
| +4,84% |
| | depart
| 1,317,180
| 1,279,220
| +2,96% |
18,353,340 |
17,169,500 |
+6,89% |
| | Total
| 2,349,610
| 2,252,880
| +4,29% |
32,546,450 |
30,706,720 |
+5,99% |
| Commercial port
| | | | | | | |
| Liquids in bulk
| arrive |
| | | | | |
| | depart
| 17,155 |
15,483 | +10,79%
| 182,163 |
199,967 | -8,91%
|
| | Total
| 17,155 |
15,483 | +10,79%
| 182,163 |
199,967 | -8,91%
|
| Solids in bulk
| arrive |
61,807 | 47,751
| +29,43% |
620,552 | 701,101
| -11,49% |
| | depart
| 27,894 |
49,795 | -43,99%
| 627,424 |
692,701 | -9,43%
|
| | Total
| 89,701 |
97,546 | -8,05%
| 1,247,976
| 1,393,802
| -10,47% |
Diversified
merchandise
| arrive |
2,965 | 3,590
| -17,41% |
40,114 | 35,956
| +11,56% |
| | depart
| 43,545 |
24,741 | +76,00%
| 363,451 |
404,955 | -10,25%
|
| | Total
| 46,510 |
28,331 | +64,16%
| 403,565 |
440,911 | -8,48%
|
Merchandise
commercial port
| arrive |
64,772 | 51,341
| +26,16% |
660,666 | 737,057
| -10,37% |
| | depart
| 88,594 |
90,019 | -1,59%
| 1,173,038
| 1,297,623
| -9,61% |
| | Total
| 153,366 |
141,360 | +8,49%
| 1,833,704
| 2,034,680
| -9,88% |
| | | | | | | | |
Port of Calais
General total
| | 2,502,976
| 2,394,240
| +4,54% |
34,380,154 |
32,741,400 |
+5,00% |
|
|