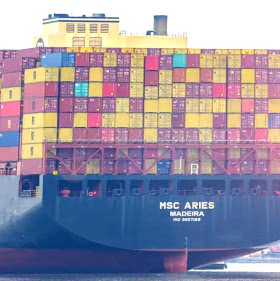
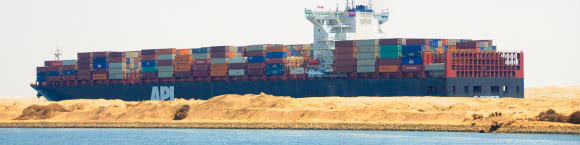
Nel primo trimestre di quest'anno il gruppo armatoriale DFDS ha registrato un passivo netto di 101 milioni di corone danesi (15,9 milioni di dollari) su un ricavo di 1,076 miliardi di corone danesi, contro un passivo netto di 85 milioni di corone danesi ed un ricavo di 1,050 miliardi di corone danesi nel corrispondente periodo del 2002. Il periodo si è concluso con un passivo operativo di 56 milioni di corone danesi (-106 milioni nel primo trimestre 2002). Nel primo trimestre di quest'anno il gruppo armatoriale DFDS ha registrato un passivo netto di 101 milioni di corone danesi (15,9 milioni di dollari) su un ricavo di 1,076 miliardi di corone danesi, contro un passivo netto di 85 milioni di corone danesi ed un ricavo di 1,050 miliardi di corone danesi nel corrispondente periodo del 2002. Il periodo si è concluso con un passivo operativo di 56 milioni di corone danesi (-106 milioni nel primo trimestre 2002).
La crescita del giro d'affari è stata determinata principalmente dall'aumento di attività e dalle nuove acquisizioni effettuate dalla filiale DFDS Tor Line, mentre la filiale DFDS Seaways ha determinato un calo del 17% del ricavo.
DFDS Group
Key Figures
(Source: DFDS)
DKK millions |
2003
Q1 |
2002
Q1 |
2002
Full year |
| |
|
|
|
Income statement |
|
|
|
| |
|
|
|
Revenue |
1,076 |
1,050 |
4,870 |
Profit/loss on disposal of ships, buildings and terminals |
-7 |
0 |
-14 |
Operating profit before depreciation (EBITDA) |
45 |
18 |
768 |
Operating profit (EBITA) |
-56 |
-106 |
119 |
Profit before financing, etc. (EBIT) |
-57 |
-108 |
114 |
Financing, net |
-54 |
-30 |
-133 |
Profit before tax and extraordinary items |
-111 |
-138 |
-19 |
Profit for the period before minority interest |
-100 |
-82 |
200 |
Profit for the period |
-101 |
-85 |
189 |
Profit for analytical purposes 1) |
-101 |
-84 |
-4 |
| |
|
|
|
Balance Sheet |
|
|
|
Fixed assets |
5,482 |
5,697 |
5,497 |
Current assets |
1,169 |
1,556 |
1,385 |
| |
------- |
------- |
------- |
Total assets |
6,651 |
7,253 |
6,882 |
| |
|
|
|
Equity |
2,439 |
2,509 |
2,604 |
Minority interests |
143 |
188 |
146 |
Provisions |
166 |
481 |
189 |
Long-term liabilities other than provisions |
2,433 |
2,671 |
2,727 |
Short-term liabilities other than provisions |
1,470 |
1,404 |
1,216 |
| |
------- |
------- |
------- |
Total equity and liabilities |
6,651 |
7,253 |
6,882 |
| |
|
|
|
Net interest bearing debt |
2,595 |
2,609 |
2,515 |
| |
|
|
|
Number of employees |
3,864 |
3,932 |
4,070 |
| |
|
|
|
Cash flow |
|
|
|
Cash flow from operating activities 2) |
92 |
140 |
824 |
Cash flow from investing activities |
-96 |
-62 |
-496 |
Net cash flow from operating and investing activities |
-4 |
78 |
328 |
| |
|
|
|
Dividend |
- |
- |
53 |
| |
|
|
|
Financial ratios, % |
|
|
|
Operating profit margin |
-5.2 |
-10.1 |
2.4 |
Return on invested capital (ROIC) p.a. |
-4.5 |
-5.9 |
0.0 |
Return on equity p.a. |
-15.8 |
-13.3 |
-0.2 |
Equity ratio |
38.8 |
37.2 |
40.0 |
1)
|
Profit for analytical purposes is calculated by adjusting the profit for the period for the effect of extraordinary items and adjustment of previous years' taxes in accordance with the recommandations of the Danish Association of Financial Analysts.
|
2)
|
Cash flow from operating activities after tax, before financing and extraordinary items.
|
|
|