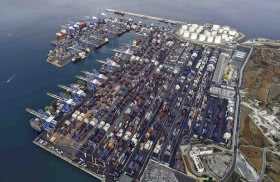
In attesa dei dati definitivi del traffico container realizzato lo scorso anno nei porti di Hong Kong e di Kaohiung, il ministero cinese delle Comunicazioni ha annunciato che nel 2003 i porti di Shanghai e Shenzhen hanno raggiunto il terzo e quarto gradino della graduatoria dei porti container mondiali, classifica che nel 2002 li vedeva rispettivamente al quarto e al sesto posto. Nel 2003 il porto di Busan, con una movimentazione complessiva di 10.370.000 teu, è scivolato al quinto posto della graduatoria, mentre Kaohsiung, per il quale è previsto un traffico di circa 8,8 milioni di teu, si insedierà al sesto posto. In attesa dei dati definitivi del traffico container realizzato lo scorso anno nei porti di Hong Kong e di Kaohiung, il ministero cinese delle Comunicazioni ha annunciato che nel 2003 i porti di Shanghai e Shenzhen hanno raggiunto il terzo e quarto gradino della graduatoria dei porti container mondiali, classifica che nel 2002 li vedeva rispettivamente al quarto e al sesto posto. Nel 2003 il porto di Busan, con una movimentazione complessiva di 10.370.000 teu, è scivolato al quinto posto della graduatoria, mentre Kaohsiung, per il quale è previsto un traffico di circa 8,8 milioni di teu, si insedierà al sesto posto.
Secondo i dati statistici preliminari, lo scorso anno il porto di Shanghai ha movimentato circa 11.280.000 teu, con una progressione del 31% sul 2002, mentre il porto di Shenzhen ha movimentato circa 10.650.000 teu (+39,9%).
Venerdì scorso intanto il governo di Hong Kong ha reso noti i dati definitivi del traffico registrato nel porto nei primi dieci mesi del 2003.
Summary Statistics on Port Traffic of Hong Kong
October 2003
(Source: Port, Maritime and Logistics Development Unit, Hong Kong Economic Development and Labour Bureau)
Total (Inward + Outward) Container Throughput
| |
Kwai Chung Terminals<3> |
Stream &
other berths<3> |
|
Kwai Chung Terminals<3> |
Stream &
other berths<3> |
|
Year/
month |
Ocean
vessel |
River
cargo
vessel |
Sub
total |
Ocean
vessel |
River
cargo
vessel |
Total |
Ocean
vessel |
River
cargo
vessel |
Sub
total |
Ocean
vessel |
River
cargo
vessel |
Total |
| |
'000 TEUs |
Year-on-year growth rate % |
| |
|
|
|
|
|
|
|
|
|
|
|
|
1990 |
N.A. |
N.A. |
3,831 |
1,198 |
71 |
5,101 |
N.A. |
N.A. |
15.5 |
12.3 |
-10.6 |
14.3 |
1991 |
N.A. |
N.A. |
4,514 |
1,573 |
74 |
6,162 |
N.A. |
N.A. |
17.8 |
31.3 |
4.8 |
20.8 |
1992 |
N.A. |
N.A. |
5,079 |
<1>2,461 |
<1,2>432 |
7,972 |
N.A. |
N.A. |
12.5 |
<1> |
<1> |
29.4 |
1993 |
N.A. |
N.A. |
5,797 |
2,797 |
610 |
9,204 |
N.A. |
N.A. |
14.1 |
13.7 |
41.3 |
15.5 |
1994 |
N.A. |
N.A. |
7,278 |
2,839 |
933 |
11,050 |
N.A. |
N.A. |
25.6 |
1.5 |
52.8 |
20.1 |
1995 |
8,039 |
217 |
8,256 |
2,930 |
1,364 |
12,550 |
N.A. |
N.A. |
13.4 |
3.2 |
46.3 |
13.6 |
1996 |
8,218 |
468 |
8,686 |
3,045 |
1,729 |
13,460 |
2.2 |
115.3 |
5.2 |
4.0 |
26.7 |
7.3 |
1997 |
8,975 |
515 |
9,490 |
3,156 |
1,922 |
14,567 |
9.2 |
10.0 |
9.3 |
3.6 |
11.2 |
8.2 |
| |
(9,049) |
(515) |
(9,564) |
(2,900) |
(1,922) |
(14,386) |
|
|
|
|
|
|
1998 |
8,869 |
686 |
9,555 |
2,641 |
2,386 |
14,582 |
-2.0 |
33.2 |
-0.1 |
-8.9 |
24.1 |
1.4 |
1999 |
9,511 |
784 |
10,295 |
2,838 |
3,077 |
16,211 |
7.2 |
14.3 |
7.7 |
7.5 |
29.0 |
11.2 |
2000 |
10,664 |
938 |
11,603 |
3,033 |
3,462 |
18,098 |
12.1 |
19.7 |
12.7 |
6.8 |
12.5 |
11.6 |
2001 |
10,154 |
1,131 |
11,285 |
3,011 |
3,531 |
17,826 |
-4.8 |
20.6 |
-2.7 |
-0.7 |
2.0 |
-1.5 |
2002 |
10,584 |
1,308 |
11,892 |
3,326 |
3,926 |
19,144 |
4.2 |
15.6 |
5.4 |
10.5 |
11.2 |
7.4 |
| |
|
|
|
|
|
|
|
|
|
|
|
|
2003 |
|
|
|
|
|
|
|
|
|
|
|
|
Jan |
903 |
133 |
1,036 |
301 |
372 |
1,709 |
17.5 |
25.9 |
18.5 |
12.4 |
31.5 |
19.9 |
Feb |
689 |
96 |
785 |
218 |
258 |
1,261 |
5.3 |
41.7 |
8.7 |
15.9 |
8.5 |
9.8 |
Mar |
907 |
121 |
1,028 |
337 |
359 |
1,724 |
12.0 |
1.9 |
10.7 |
30.8 |
15.9 |
15.2 |
Apr |
909 |
119 |
1,028 |
330 |
412 |
1,769 |
6.5 |
-2.0 |
5.4 |
20.2 |
16.2 |
10.3 |
May |
885 |
102 |
988 |
309 |
365 |
1,661 |
7.3 |
-9.3 |
5.3 |
16.6 |
8.4 |
7.9 |
Jun |
856 |
104 |
960 |
309 |
391 |
1,660 |
-5.2 |
3.7 |
-4.3 |
6.9 |
22.1 |
3.0 |
Jul |
903 |
115 |
1,018 |
325 |
343 |
1,686 |
-3.1 |
-4.5 |
-3.3 |
3.6 |
-0.7 |
-1.5 |
Aug |
924 |
138 |
1,062 |
325 |
404 |
1,791 |
-5.2 |
28.0 |
-1.9 |
8.6 |
21.5 |
4.5 |
Sep |
957 |
138 |
1,095 |
332 |
387 |
1,814 |
-10.1 |
27.7 |
-6.6 |
17.0 |
4.2 |
-0.7 |
Oct |
903 |
122 |
1,025 |
363 |
386 |
1,773 |
-4.1 |
9.0 |
-2.7 |
22.8 |
11.6 |
4.7 |
Nov |
|
|
|
|
|
|
|
|
|
|
|
|
Dec |
|
|
|
|
|
|
|
|
|
|
|
|
| |
|
|
|
|
|
|
|
|
|
|
|
|
Cumulative |
|
|
|
|
|
|
|
|
|
|
|
|
2003 |
|
|
|
|
|
|
|
|
|
|
|
|
Jan |
903 |
133 |
1,036 |
301 |
372 |
1,709 |
17.5 |
25.9 |
18.5 |
12.4 |
31.5 |
19.9 |
Feb |
1,592 |
229 |
1,821 |
519 |
630 |
2,969 |
11.9 |
32.1 |
14.1 |
13.8 |
21.0 |
15.4 |
Mar |
2,499 |
350 |
2,849 |
856 |
988 |
4,693 |
11.9 |
19.8 |
12.8 |
20.0 |
19.1 |
15.4 |
Apr |
3,408 |
468 |
3,876 |
1,186 |
1,400 |
6,462 |
10.4 |
13.4 |
10.8 |
20.0 |
18.3 |
13.9 |
May |
4,294 |
570 |
4,864 |
1,494 |
1,765 |
8,123 |
9.8 |
8.6 |
9.6 |
19.3 |
16.1 |
12.7 |
Jun |
5,150 |
675 |
5,824 |
1,803 |
2,156 |
9,783 |
7.0 |
7.8 |
7.1 |
17.0 |
17.1 |
10.9 |
Jul |
6,053 |
789 |
6,842 |
2,128 |
2,499 |
11,469 |
5.3 |
5.8 |
5.4 |
14.7 |
14.3 |
8.9 |
Aug |
6,976 |
927 |
7,903 |
2,453 |
2,903 |
13,260 |
3.8 |
8.6 |
4.3 |
13.9 |
15.2 |
8.3 |
Sep |
7,933 |
1,065 |
8,998 |
2,785 |
3,290 |
15,073 |
1.9 |
10.7 |
2.9 |
14.2 |
13.8 |
7.1 |
Oct |
8,836 |
1,187 |
10,023 |
3,148 |
3,676 |
16,847 |
1.3 |
10.6 |
2.3 |
15.2 |
13.6 |
6.8 |
Nov |
|
|
|
|
|
|
|
|
|
|
|
|
Dec |
|
|
|
|
|
|
|
|
|
|
|
|
Inward Container Throughput
| |
Kwai Chung Terminals<3> |
Stream &
other berths<3> |
|
Kwai Chung Terminals<3> |
Stream &
other berths<3> |
|
Year/
month |
Ocean
vessel |
River
cargo
vessel |
Sub
total |
Ocean
vessel |
River
cargo
vessel |
Total |
Ocean
vessel |
River
cargo
vessel |
Sub
total |
Ocean
vessel |
River
cargo
vessel |
Total |
| |
'000 TEUs |
Year-on-year growth rate % |
1990 |
N.A. |
N.A. |
1,830 |
663 |
37 |
2,531 |
N.A. |
N.A. |
14.3 |
15.4 |
-18.9 |
13.9 |
1991 |
N.A. |
N.A. |
2,161 |
861 |
37 |
3,059 |
N.A. |
N.A. |
18.1 |
29.8 |
-0.6 |
20.9 |
1992 |
N.A. |
N.A. |
2,428 |
<1>1,284 |
<1,2>220 |
3,932 |
N.A. |
N.A. |
12.4 |
<1> |
<1> |
28.5 |
1993 |
N.A. |
N.A. |
2,750 |
1,503 |
314 |
4,566 |
N.A. |
N.A. |
13.2 |
17.1 |
42.7 |
16.1 |
1994 |
N.A. |
N.A. |
3,397 |
1,595 |
477 |
5,469 |
N.A. |
N.A. |
23.5 |
6.1 |
52.1 |
19.8 |
1995 |
3,792 |
112 |
3,904 |
1,612 |
698 |
6,215 |
N.A. |
N.A. |
14.9 |
1.1 |
46.4 |
13.6 |
1996 |
3,894 |
253 |
4,147 |
1,625 |
881 |
6,653 |
2.7 |
125.2 |
6.2 |
0.8 |
26.2 |
7.0 |
1997 |
4,312 |
252 |
4,564 |
1,632 |
984 |
7,181 |
10.7 |
-0.4 |
10.1 |
0.4 |
11.8 |
7.9 |
| |
(4,302) |
(252) |
(4,555) |
(1,584) |
(984) |
(7,123) |
|
|
|
|
|
|
1998 |
4,253 |
393 |
4,646 |
1,458 |
1,180 |
7,284 |
-1.2 |
55.9 |
2.0 |
-7.9 |
19.9 |
2.3 |
1999 |
4,419 |
415 |
4,834 |
1,542 |
1,650 |
8,027 |
3.9 |
5.6 |
4.1 |
5.8 |
39.8 |
10.2 |
2000 |
4,982 |
524 |
5,506 |
1,700 |
1,773 |
8,979 |
12.7 |
26.4 |
13.9 |
10.2 |
7.5 |
11.9 |
2001 |
4,755 |
621 |
5,376 |
1,669 |
1,788 |
8,833 |
-4.6 |
18.4 |
-2.4 |
-1.8 |
0.8 |
-1.6 |
2002 |
4,994 |
711 |
5,706 |
1,775 |
2,011 |
9,492 |
5.0 |
14.5 |
6.1 |
6.4 |
12.5 |
7.5 |
| |
|
|
|
|
|
|
|
|
|
|
|
|
2003 |
|
|
|
|
|
|
|
|
|
|
|
|
Jan |
424 |
81 |
505 |
149 |
196 |
850 |
16.4 |
58.4 |
21.5 |
-4.3 |
46.1 |
20.5 |
Feb |
370 |
45 |
414 |
123 |
126 |
664 |
15.5 |
25.1 |
16.5 |
17.3 |
-4.7 |
11.9 |
Mar |
424 |
66 |
490 |
180 |
182 |
852 |
9.9 |
11.2 |
10.1 |
26.0 |
18.7 |
14.9 |
Apr |
431 |
67 |
498 |
164 |
205 |
867 |
8.5 |
12.3 |
9.0 |
4.7 |
19.9 |
10.5 |
May |
420 |
59 |
479 |
160 |
195 |
833 |
6.1 |
4.6 |
5.9 |
9.8 |
16.6 |
9.0 |
Jun |
398 |
62 |
459 |
162 |
203 |
824 |
-4.7 |
13.8 |
-2.5 |
2.8 |
19.7 |
3.3 |
Jul |
426 |
69 |
495 |
167 |
179 |
841 |
0.1 |
2.9 |
0.5 |
6.5 |
0.8 |
1.7 |
Aug |
430 |
81 |
512 |
160 |
209 |
880 |
-5.5 |
33.9 |
-0.8 |
-0.6 |
22.8 |
4.0 |
Sep |
441 |
83 |
524 |
155 |
204 |
883 |
-13.0 |
27.1 |
-8.5 |
8.0 |
1.1 |
-3.8 |
Oct |
419 |
74 |
493 |
187 |
193 |
874 |
-2.5 |
9.5 |
-0.9 |
21.3 |
4.8 |
4.4 |
Nov |
|
|
|
|
|
|
|
|
|
|
|
|
Dec |
|
|
|
|
|
|
|
|
|
|
|
|
| |
|
|
|
|
|
|
|
|
|
|
|
|
Cumulative |
|
|
|
|
|
|
|
|
|
|
|
|
2003 |
|
|
|
|
|
|
|
|
|
|
|
|
Jan |
424 |
81 |
505 |
149 |
196 |
850 |
16.4 |
58.4 |
21.5 |
-4.3 |
46.1 |
20.5 |
Feb |
794 |
125 |
919 |
272 |
322 |
1,514 |
16.0 |
44.7 |
19.2 |
4.4 |
20.9 |
16.6 |
Mar |
1,218 |
191 |
1,409 |
452 |
505 |
2,366 |
13.8 |
31.1 |
15.9 |
12.1 |
20.1 |
16.0 |
Apr |
1,649 |
258 |
1,907 |
616 |
710 |
3,233 |
12.4 |
25.6 |
14.0 |
10.0 |
20.0 |
14.5 |
May |
2,069 |
317 |
2,386 |
776 |
905 |
4,066 |
11.0 |
21.1 |
12.3 |
10.0 |
19.3 |
13.3 |
Jun |
2,467 |
378 |
2,845 |
938 |
1,108 |
4,891 |
8.2 |
19.9 |
9.6 |
8.7 |
19.4 |
11.5 |
Jul |
2,893 |
447 |
3,340 |
1,105 |
1,287 |
5,732 |
6.9 |
16.9 |
8.1 |
8.3 |
16.4 |
9.9 |
Aug |
3,323 |
529 |
3,852 |
1,264 |
1,496 |
6,612 |
5.1 |
19.2 |
6.8 |
7.1 |
17.2 |
9.1 |
Sep |
3,764 |
611 |
4,376 |
1,420 |
1,700 |
7,495 |
2.6 |
20.2 |
4.7 |
7.2 |
15.0 |
7.4 |
Oct |
4,184 |
685 |
4,869 |
1,607 |
1,893 |
8,369 |
2.1 |
19.0 |
4.1 |
8.7 |
13.9 |
7.1 |
Nov |
|
|
|
|
|
|
|
|
|
|
|
|
Dec |
|
|
|
|
|
|
|
|
|
|
|
|
Outward Container Throughput
| |
Kwai Chung Terminals<3> |
Stream &
other berths<3> |
|
Kwai Chung Terminals<3> |
Stream &
other berths<3> |
|
Year/
month |
Ocean
vessel |
River
cargo
vessel |
Sub
total |
Ocean
vessel |
River
cargo
vessel |
Total |
Ocean
vessel |
River
cargo
vessel |
Sub
total |
Ocean
vessel |
River
cargo
vessel |
Total |
| |
'000 TEUs |
Year-on-year growth rate % |
1990 |
N.A. |
N.A. |
2,001 |
535 |
33 |
2,570 |
N.A. |
N.A. |
16.6 |
8.7 |
1.0 |
14.6 |
1991 |
N.A. |
N.A. |
2,353 |
712 |
37 |
3,102 |
N.A. |
N.A. |
17.6 |
33.0 |
11.0 |
20.7 |
1992 |
N.A. |
N.A. |
2,651 |
<1>1,178 |
<1,2>212 |
4,040 |
N.A. |
N.A. |
12.6 |
<1> |
<1> |
30.2 |
1993 |
N.A. |
N.A. |
3,047 |
1,294 |
297 |
4,638 |
N.A. |
N.A. |
15.0 |
9.9 |
39.9 |
14.8 |
1994 |
N.A. |
N.A. |
3,881 |
1,244 |
456 |
5,581 |
N.A. |
N.A. |
27.4 |
-3.9 |
53.6 |
20.3 |
1995 |
4,247 |
105 |
4,352 |
1,317 |
666 |
6,335 |
N.A. |
N.A. |
12.1 |
5.9 |
46.1 |
13.5 |
1996 |
4,324 |
215 |
4,539 |
1,420 |
848 |
6,808 |
1.8 |
104.7 |
4.3 |
7.8 |
27.3 |
7.5 |
1997 |
4,663 |
263 |
4,926 |
1,523 |
938 |
7,387 |
7.8 |
22.4 |
8.5 |
7.2 |
10.6 |
8.5 |
| |
(4,746) |
(263) |
(5,009) |
(1,316) |
(938) |
(7,264) |
|
|
|
|
|
|
1998 |
4,616 |
293 |
4,909 |
1,183 |
1,206 |
7,297 |
-2.7 |
11.3 |
-2.0 |
-10.2 |
28.6 |
0.5 |
1999 |
5,092 |
369 |
5,461 |
1,296 |
1,427 |
8,184 |
10.3 |
26.0 |
11.2 |
9.6 |
18.4 |
12.2 |
2000 |
5,683 |
414 |
6,096 |
1,333 |
1,689 |
9,118 |
11.6 |
12.2 |
11.6 |
2.8 |
18.4 |
11.4 |
2001 |
5,399 |
510 |
5,909 |
1,341 |
1,743 |
8,993 |
-5.0 |
23.3 |
-3.1 |
0.6 |
3.2 |
-1.4 |
2002 |
5,589 |
597 |
6,186 |
1,551 |
1,916 |
9,652 |
3.5 |
17.0 |
4.7 |
15.6 |
9.9 |
7.3 |
| |
|
|
|
|
|
|
|
|
|
|
|
|
2003 |
|
|
|
|
|
|
|
|
|
|
|
|
Jan |
479 |
52 |
531 |
152 |
176 |
859 |
18.5 |
-4.3 |
15.8 |
35.5 |
18.3 |
19.4 |
Feb |
320 |
51 |
371 |
95 |
132 |
597 |
-4.5 |
60.2 |
1.1 |
14.2 |
25.2 |
7.6 |
Mar |
483 |
55 |
538 |
157 |
176 |
871 |
13.9 |
-7.4 |
11.3 |
36.7 |
13.2 |
15.6 |
Apr |
478 |
52 |
529 |
166 |
207 |
902 |
4.6 |
-16.0 |
2.2 |
40.7 |
12.8 |
10.1 |
May |
466 |
43 |
509 |
149 |
170 |
828 |
8.4 |
-23.1 |
4.8 |
24.9 |
0.3 |
6.9 |
Jun |
458 |
43 |
501 |
147 |
187 |
836 |
-5.6 |
-8.0 |
-5.8 |
11.8 |
24.9 |
2.7 |
Jul |
477 |
46 |
522 |
157 |
165 |
844 |
-5.9 |
-13.9 |
-6.6 |
0.8 |
-2.3 |
-4.5 |
Aug |
494 |
56 |
550 |
165 |
196 |
911 |
-5.0 |
20.3 |
-2.9 |
19.3 |
20.1 |
4.9 |
Sep |
515 |
55 |
571 |
177 |
183 |
930 |
-7.4 |
28.6 |
-4.8 |
26.2 |
8.0 |
2.3 |
Oct |
483 |
48 |
532 |
176 |
192 |
900 |
-5.4 |
8.3 |
-4.3 |
24.5 |
19.5 |
4.9 |
Nov |
|
|
|
|
|
|
|
|
|
|
|
|
Dec |
|
|
|
|
|
|
|
|
|
|
|
|
| |
|
|
|
|
|
|
|
|
|
|
|
|
Cumulative |
|
|
|
|
|
|
|
|
|
|
|
|
2003 |
|
|
|
|
|
|
|
|
|
|
|
|
Jan |
479 |
52 |
531 |
152 |
176 |
859 |
18.5 |
-4.3 |
15.8 |
35.5 |
18.3 |
19.4 |
Feb |
798 |
104 |
902 |
246 |
307 |
1,456 |
8.1 |
19.5 |
9.3 |
26.4 |
21.2 |
14.3 |
Mar |
1,281 |
159 |
1,440 |
404 |
484 |
2,327 |
10.2 |
8.6 |
10.0 |
30.3 |
18.1 |
14.7 |
Apr |
1,759 |
210 |
1,969 |
569 |
690 |
3,229 |
8.6 |
1.3 |
7.8 |
33.1 |
16.5 |
13.4 |
May |
2,225 |
254 |
2,478 |
718 |
860 |
4,057 |
8.6 |
-3.9 |
7.2 |
31.3 |
12.9 |
12.0 |
Jun |
2,683 |
296 |
2,979 |
865 |
1,048 |
4,892 |
5.9 |
-4.5 |
4.7 |
27.5 |
14.9 |
10.3 |
Jul |
3,160 |
342 |
3,502 |
1,023 |
1,212 |
5,737 |
3.9 |
-5.9 |
2.9 |
22.5 |
12.2 |
7.8 |
Aug |
3,653 |
399 |
4,052 |
1,188 |
1,408 |
6,648 |
2.6 |
-2.9 |
2.0 |
22.1 |
13.2 |
7.4 |
Sep |
4,168 |
454 |
4,622 |
1,366 |
1,590 |
7,578 |
1.3 |
0.1 |
1.1 |
22.6 |
12.6 |
6.8 |
Oct |
4,652 |
502 |
5,154 |
1,541 |
1,783 |
8,478 |
0.5 |
0.8 |
0.6 |
22.8 |
13.3 |
6.6 |
Nov |
|
|
|
|
|
|
|
|
|
|
|
|
Dec |
|
|
|
|
|
|
|
|
|
|
|
|
Total (Inward + Outward) Container Throughput by ocean vessel and river
Year/month |
Ocean
vessel<3> |
River
cargo
vessel |
Ocean
vessel<3> |
River
cargo
vessel |
| |
'000 TEUs |
Year-on-year growth rate % |
1995 |
10,968 |
1,581 |
N.A. |
N.A. |
1996 |
11,263 |
2,197 |
2.7 |
38.9 |
1997 |
12,130 |
2,437 |
7.7 |
10.9 |
| |
(11,949) |
(2,437) |
|
|
1998 |
11,510 |
3,072 |
-3.7 |
26.0 |
1999 |
12,350 |
3,861 |
7.3 |
25.7 |
2000 |
13,697 |
4,401 |
10.9 |
14.0 |
2001 |
13,165 |
4,662 |
-3.9 |
5.9 |
2002 |
13,910 |
5,234 |
5.7 |
12.3 |
| |
|
|
|
|
2003 |
|
|
|
|
Jan |
1,203 |
505 |
16.2 |
30.0 |
Feb |
907 |
353 |
7.7 |
15.9 |
Mar |
1,245 |
479 |
16.5 |
12.0 |
Apr |
1,238 |
531 |
9.8 |
11.6 |
May |
1,194 |
467 |
9.6 |
4.0 |
Jun |
1,165 |
495 |
-2.2 |
17.7 |
Jul |
1,227 |
458 |
-1.4 |
-1.7 |
Aug |
1,249 |
542 |
-2.0 |
23.1 |
Sep |
1,289 |
525 |
-4.4 |
9.5 |
Oct |
1,266 |
508 |
2.4 |
11.0 |
Nov |
|
|
|
|
Dec |
|
|
|
|
| |
|
|
|
|
Cumulative |
|
|
|
|
2003 |
|
|
|
|
Jan |
1,203 |
505 |
16.2 |
30.0 |
Feb |
2,111 |
859 |
12.3 |
23.8 |
Mar |
3,355 |
1,338 |
13.9 |
19.3 |
Apr |
4,594 |
1,869 |
12.7 |
17.0 |
May |
5,788 |
2,335 |
12.1 |
14.1 |
Jun |
6,953 |
2,830 |
9.4 |
14.8 |
Jul |
8,180 |
3,289 |
7.6 |
12.1 |
Aug |
9,429 |
3,831 |
6.2 |
13.6 |
Sep |
10,718 |
4,355 |
4.8 |
13.1 |
Oct |
11,984 |
4,863 |
4.6 |
12.8 |
Nov |
|
|
|
|
Dec |
|
|
|
|
Percentage Distribution of Total (Inward + Outward)
Container Throughput by Handling Location
| |
Kwai Chung Terminals<3> |
Stream &
other berths<3> |
|
Year/month |
Ocean
vessel |
River
cargo
vessel |
Sub
total |
Ocean
vessel |
River
cargo
vessel |
Total |
| |
% |
% |
% |
% |
% |
% |
1990 |
N.A. |
N.A. |
75.1 |
23.5 |
1.4 |
100.0 |
1991 |
N.A. |
N.A. |
73.3 |
25.5 |
1.2 |
100.0 |
1992 |
N.A. |
N.A. |
63.7 |
<1>30.9 |
<1,2>5.4 |
100.0 |
1993 |
N.A. |
N.A. |
63.0 |
30.4 |
6.6 |
100.0 |
1994 |
N.A. |
N.A. |
65.9 |
25.7 |
8.4 |
100.0 |
1995 |
64.1 |
1.7 |
65.8 |
23.3 |
10.9 |
100.0 |
1996 |
61.1 |
3.5 |
64.5 |
22.6 |
12.8 |
100.0 |
1997 |
61.6 |
3.5 |
65.1 |
21.7 |
13.2 |
100.0 |
| |
(62.9) |
(3.6) |
(66.5) |
(20.2) |
(13.4) |
(100.0) |
1998 |
60.8 |
4.7 |
65.5 |
18.1 |
16.4 |
100.0 |
1999 |
58.7 |
4.8 |
63.5 |
17.5 |
19.0 |
100.0 |
2000 |
58.9 |
5.2 |
64.1 |
16.8 |
19.1 |
100.0 |
2001 |
57.0 |
6.3 |
63.3 |
16.9 |
19.8 |
100.0 |
2002 |
55.3 |
6.8 |
62.1 |
17.4 |
20.5 |
100.0 |
| |
|
|
|
|
|
|
2003 |
|
|
|
|
|
|
Jan |
52.9 |
7.8 |
60.6 |
17.6 |
21.8 |
100.0 |
Feb |
54.7 |
7.6 |
62.3 |
17.3 |
20.4 |
100.0 |
Mar |
52.6 |
7.0 |
59.6 |
19.6 |
20.8 |
100.0 |
Apr |
51.4 |
6.7 |
58.1 |
18.6 |
23.3 |
100.0 |
May |
53.3 |
6.1 |
59.5 |
18.6 |
22.0 |
100.0 |
Jun |
51.6 |
6.3 |
57.9 |
18.6 |
23.5 |
100.0 |
Jul |
53.6 |
6.8 |
60.4 |
19.3 |
20.4 |
100.0 |
Aug |
51.6 |
7.7 |
59.3 |
18.2 |
22.6 |
100.0 |
Sep |
52.8 |
7.6 |
60.4 |
18.3 |
21.3 |
100.0 |
Oct |
50.9 |
6.9 |
57.8 |
20.5 |
21.7 |
100.0 |
Nov |
|
|
|
|
|
|
Dec |
|
|
|
|
|
|
| |
|
|
|
|
|
|
Cumulative |
|
|
|
|
|
|
2003 |
|
|
|
|
|
|
Jan |
52.9 |
7.8 |
60.6 |
17.6 |
21.8 |
100.0 |
Feb |
53.6 |
7.7 |
61.3 |
17.5 |
21.2 |
100.0 |
Mar |
53.3 |
7.4 |
60.7 |
18.2 |
21.1 |
100.0 |
Apr |
52.7 |
7.2 |
60.0 |
18.3 |
21.7 |
100.0 |
May |
52.9 |
7.0 |
59.9 |
18.4 |
21.7 |
100.0 |
Jun |
52.6 |
6.9 |
59.5 |
18.4 |
22.0 |
100.0 |
Jul |
52.8 |
6.9 |
59.7 |
18.6 |
21.8 |
100.0 |
Aug |
52.6 |
7.0 |
59.6 |
18.5 |
21.9 |
100.0 |
Sep |
52.6 |
7.1 |
59.7 |
18.5 |
21.8 |
100.0 |
Oct |
52.4 |
7.0 |
59.5 |
18.7 |
21.8 |
100.0 |
Nov |
|
|
|
|
|
|
Dec |
|
|
|
|
|
|
Percentage Share of Empty Containers (in TEU)
| |
Kwai Chung Terminals<3> |
Stream &
other berths<3> |
|
| |
Inward
% |
Outward
% |
|
Ocean vessel |
River cargo vessel |
Total |
| |
Ocean
vessel |
River
cargo
vessel |
Sub
total |
Ocean
vessel |
River
cargo
vessel |
Sub
total |
Total
% |
Inward
% |
Outward
% |
Total
% |
Inward
% |
Outward
% |
Total
% |
Inward
% |
Outward
% |
Total
% |
| |
|
|
|
|
|
|
|
|
|
|
|
|
|
|
|
|
1990 |
N.A. |
N.A. |
29.5 |
N.A. |
N.A. |
7.1 |
17.8 |
18.1 |
13.4 |
16.0 |
29.5 |
36.0 |
32.6 |
26.5 |
8.8 |
17.6 |
1991 |
N.A. |
N.A. |
28.3 |
N.A. |
N.A. |
5.5 |
16.4 |
11.4 |
13.8 |
12.5 |
31.9 |
30.5 |
31.2 |
23.6 |
7.7 |
15.6 |
1992 |
N.A. |
N.A. |
27.8 |
N.A. |
N.A. |
4.6 |
15.7 |
9.8 |
15.3 |
12.4 |
40.5 |
25.8 |
33.3 |
22.6 |
8.9 |
15.7 |
1993 |
N.A. |
N.A. |
28.1 |
N.A. |
N.A. |
5.9 |
16.4 |
10.4 |
13.3 |
11.7 |
36.5 |
29.8 |
33.3 |
22.8 |
9.5 |
16.1 |
1994 |
N.A. |
N.A. |
19.7 |
N.A. |
N.A. |
7.8 |
13.3 |
8.7 |
14.2 |
11.1 |
38.7 |
28.1 |
33.5 |
18.1 |
10.8 |
14.4 |
1995 |
20.1 |
2.5 |
19.6 |
7.7 |
39.2 |
8.4 |
13.7 |
9.0 |
16.1 |
12.2 |
48.7 |
30.9 |
40.0 |
20.1 |
12.4 |
16.2 |
1996 |
20.2 |
13.3 |
19.7 |
7.9 |
22.7 |
8.6 |
13.9 |
13.8 |
14.1 |
13.9 |
53.9 |
29.2 |
41.8 |
22.8 |
12.3 |
17.5 |
1997 |
19.0 |
14.0 |
18.8 |
8.3 |
24.8 |
9.2 |
13.8 |
15.8 |
16.6 |
16.2 |
55.3 |
29.0 |
42.5 |
23.1 |
13.2 |
18.1 |
| |
(19.1) |
(14.0) |
(18.8) |
(8.1) |
(24.8) |
(9.0) |
(13.7) |
(16.3) |
(19.2) |
(17.6) |
(55.3) |
(29.0) |
(42.5) |
(23.3) |
(13.4) |
(18.3) |
1998 |
27.2 |
15.0 |
26.1 |
6.9 |
41.6 |
9.0 |
17.3 |
13.7 |
26.1 |
19.3 |
49.3 |
29.0 |
39.0 |
27.4 |
15.0 |
21.2 |
1999 |
27.1 |
12.6 |
25.9 |
5.1 |
35.4 |
7.1 |
15.9 |
11.8 |
20.0 |
15.5 |
53.6 |
31.1 |
43.2 |
28.9 |
13.3 |
21.0 |
2000 |
31.2 |
17.3 |
29.9 |
4.4 |
24.4 |
5.7 |
17.2 |
10.1 |
15.4 |
12.4 |
51.4 |
33.6 |
42.7 |
30.4 |
12.3 |
21.3 |
2001 |
31.0 |
16.4 |
29.3 |
4.1 |
18.4 |
5.4 |
16.8 |
7.9 |
11.7 |
9.6 |
44.8 |
37.6 |
41.3 |
28.4 |
12.6 |
20.4 |
2002 |
30.8 |
9.9 |
28.2 |
4.2 |
19.7 |
5.7 |
16.5 |
5.8 |
7.7 |
6.7 |
42.7 |
40.7 |
41.7 |
27.1 |
13.0 |
20.0 |
| |
|
|
|
|
|
|
|
|
|
|
|
|
|
|
|
|
2003 |
|
|
|
|
|
|
|
|
|
|
|
|
|
|
|
|
Jan |
34.1 |
6.7 |
29.7 |
3.9 |
25.0 |
6.0 |
17.5 |
7.8 |
5.8 |
6.8 |
40.7 |
43.6 |
42.1 |
28.4 |
13.6 |
21.0 |
Feb |
29.9 |
10.5 |
27.8 |
6.2 |
19.0 |
8.0 |
18.5 |
6.9 |
6.9 |
6.9 |
40.8 |
38.4 |
39.6 |
26.4 |
14.5 |
20.8 |
Mar |
20.1 |
8.7 |
18.5 |
5.0 |
17.1 |
6.3 |
12.1 |
5.3 |
6.8 |
6.0 |
36.3 |
40.3 |
38.3 |
19.5 |
13.3 |
16.4 |
Apr |
24.2 |
9.1 |
22.2 |
5.6 |
17.9 |
6.8 |
14.3 |
4.5 |
5.6 |
5.1 |
36.5 |
40.7 |
38.6 |
22.2 |
14.4 |
18.2 |
May |
27.0 |
8.5 |
24.7 |
6.2 |
16.6 |
7.1 |
15.6 |
6.8 |
5.4 |
6.1 |
37.8 |
40.1 |
38.9 |
24.3 |
13.6 |
19.0 |
Jun |
31.0 |
12.8 |
28.6 |
4.1 |
24.6 |
5.9 |
16.7 |
6.5 |
6.0 |
6.3 |
40.2 |
43.4 |
41.7 |
27.1 |
14.3 |
20.7 |
Jul |
33.6 |
10.3 |
30.4 |
3.4 |
22.5 |
5.1 |
17.4 |
7.0 |
6.1 |
6.6 |
36.4 |
39.1 |
37.7 |
27.0 |
11.9 |
19.5 |
Aug |
32.2 |
11.0 |
28.8 |
2.8 |
21.0 |
4.7 |
16.3 |
8.9 |
5.9 |
7.3 |
39.8 |
41.6 |
40.7 |
27.8 |
12.8 |
20.2 |
Sep |
34.3 |
8.8 |
30.3 |
3.1 |
16.4 |
4.4 |
16.8 |
8.1 |
5.9 |
6.9 |
39.0 |
40.6 |
39.8 |
28.4 |
11.8 |
19.9 |
Oct |
30.8 |
7.6 |
27.3 |
3.9 |
19.0 |
5.3 |
15.9 |
7.5 |
5.3 |
6.4 |
36.2 |
38.1 |
37.2 |
25.0 |
12.3 |
18.6 |
Nov |
|
|
|
|
|
|
|
|
|
|
|
|
|
|
|
|
Dec |
|
|
|
|
|
|
|
|
|
|
|
|
|
|
|
|
| |
|
|
|
|
|
|
|
|
|
|
|
|
|
|
|
|
Cumulative |
|
|
|
|
|
|
|
|
|
|
|
|
|
|
|
|
2003 |
|
|
|
|
|
|
|
|
|
|
|
|
|
|
|
|
Jan |
34.1 |
6.7 |
29.7 |
3.9 |
25.0 |
6.0 |
17.5 |
7.8 |
5.8 |
6.8 |
40.7 |
43.6 |
42.1 |
28.4 |
13.6 |
21.0 |
Feb |
32.1 |
8.1 |
28.9 |
4.8 |
22.0 |
6.8 |
17.9 |
7.4 |
6.2 |
6.8 |
40.7 |
41.4 |
41.0 |
27.5 |
14.0 |
20.9 |
Mar |
27.9 |
8.3 |
25.3 |
4.9 |
20.3 |
6.6 |
15.8 |
6.5 |
6.4 |
6.5 |
39.1 |
41.0 |
40.0 |
24.6 |
13.7 |
19.2 |
Apr |
27.0 |
8.5 |
24.5 |
5.1 |
19.7 |
6.7 |
15.4 |
6.0 |
6.2 |
6.1 |
38.4 |
40.9 |
39.6 |
24.0 |
13.9 |
19.0 |
May |
27.0 |
8.5 |
24.5 |
5.4 |
19.2 |
6.8 |
15.5 |
6.2 |
6.0 |
6.1 |
38.3 |
40.8 |
39.5 |
24.1 |
13.8 |
19.0 |
Jun |
27.6 |
9.2 |
25.2 |
5.1 |
20.0 |
6.6 |
15.7 |
6.2 |
6.0 |
6.1 |
38.6 |
41.2 |
39.9 |
24.6 |
13.9 |
19.3 |
Jul |
28.5 |
9.4 |
25.9 |
4.9 |
20.3 |
6.4 |
15.9 |
6.3 |
6.0 |
6.2 |
38.3 |
40.9 |
39.6 |
24.9 |
13.6 |
19.3 |
Aug |
29.0 |
9.6 |
26.3 |
4.6 |
20.4 |
6.2 |
16.0 |
6.7 |
6.0 |
6.4 |
38.5 |
41.0 |
39.7 |
25.3 |
13.5 |
19.4 |
Sep |
29.6 |
9.5 |
26.8 |
4.4 |
19.9 |
5.9 |
16.1 |
6.8 |
6.0 |
6.4 |
38.6 |
41.0 |
39.7 |
25.7 |
13.3 |
19.5 |
Oct |
29.7 |
9.3 |
26.8 |
4.4 |
19.8 |
5.9 |
16.1 |
6.9 |
5.9 |
6.4 |
38.3 |
40.7 |
39.5 |
25.6 |
13.2 |
19.4 |
Nov |
|
|
|
|
|
|
|
|
|
|
|
|
|
|
|
|
Dec |
|
|
|
|
|
|
|
|
|
|
|
|
|
|
|
|
N.A. |
Not Available |
P |
Preliminary figures |
R |
Revised figures |
( ) |
Starting from 1998, a new series of container throughputs has been compiled. To facilitate comparison, figures for 1997 compiled according to the new series is presented in brackets. |
| |
|
Explanatory Notes |
< 1 > |
Changes in the definition of ocean and river vessels
As from 1 January 1992, the statistical systems on ocean and river vessel trips, containers and cargo have been completely overhauled and redesigned by Marine Department. Reporting procedures, methodology and quality control are enhanced, in addition to full computerisation.
Also, a new definition has been adopted by both Marine Department and Census & Statistics Department in compiling shipping, cargo and container statistics related to ocean and river vessels. The new definition is based on trade route and its difference with the old one is set out below.
Old Definition (until 31 Dec 1992)
Within 24 hours of arrival and before departure, vessels are required to report entry and obtain clearance either at Marine Department's Port Formalities Office (PFO) or its District Marine Offices (DMOs).
Ocean vessels are defined operationally as vessels completing port formalities at PFO. On the other hand, vessels completing port formalities at DMOs are defined as river vessels. In most cases, the latter are vessels below 500 gross registered tonne (GRT) plying between Hong Kong and Pearl River ports (including Macau).
New Definition (effective 1 Jan 1993)
The classification of vessels entering/leaving Hong Kong water into 'ocean' and 'river' is made on the basis of the 'river trade limits' defined under the Shipping and Port Control Ordinance Cap 313. The river trade area broadly includes the Pearl River , Mirs Bay and Macau, and other inland waters in Guangdong and Guangxi which are accessible from waters in the vicinity of Hong Kong.
Ocean vessels are those vessels plying outside the legally defined river trade limits and river vessels are those plying exclusively within the limits.
Because of the changes in definitions, 1992 figures were compiled on both bases so that comparative year-on-year growth rates for 1993 statistics can be derived. |
< 2 > |
A standardised manifest has been in use from 1 Apr 92 (trial period in Jan-Mar 92) to collect river cargo and container throughput data. |
< 3> |
Starting from 1998, all figures except those on ocean trade empty TEUs are compiled by the Census and Statistics Department based on cargo manifests.
On the other hand, figures on ocean trade empty TEUs handled in "Container Terminals" and "Stream and Elsewhere" respectively are based on returns supplied by the Terminal Operators and Marine Department General Declaration Forms. |
|
|