Quotidiano indipendente di economia e politica dei trasporti
12:25 GMT+2
Nel primo semestre i cantieri navali sudcoreani hanno incamerato nuovi ordini per 9,61 milioni di tslc (+33,4%)
Il portafoglio ordini è cresciuto del 12,1%
6 settembre 2006
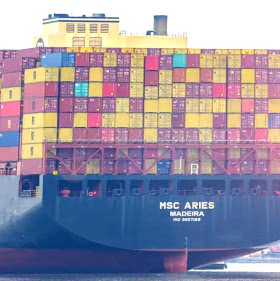
Nel primo semestre di quest'anno i cantieri navali sudcoreani hanno ottenuto nuovi ordini per un totale di 9,61 milioni di tonnellate di stazza lorda compensata, con una crescita del 33,4% rispetto alla prima metà del 2005. Sono risultati in aumento i nuovi ordini per tutte le tipologie di navi con l'eccezione delle portacontainer (ne sono state ordinate 50 contro le 131 del primo semestre dello scorso anno).
Nei primi sei mesi del 2006 i cantieri hanno completato navi per 5,74 milioni di tslc (+17,5%).
Il portafoglio ordini degli stabilimenti sudcoreani alla fine dello scorso giugno ammontava a 40 milioni di tonnellate di stazza lorda compensata (+12,1%).
Di seguito pubblichiamo i principali dati statistici dell'industria navalmeccanica sudcoreana relativi al primo semestre del 2006 diffusi dalla Korea Shipbuilders' Association (Koshipa).
- Via Raffaele Paolucci 17r/19r - 16129 Genova - ITALIA
tel.: 010.2462122, fax: 010.2516768, e-mail
Partita iva: 03532950106
Registrazione Stampa 33/96 Tribunale di Genova
Direttore responsabile Bruno Bellio Vietata la riproduzione, anche parziale, senza l'esplicito consenso dell'editore