Independent journal on economy and transport policy
04:53 GMT+2
This page has been automatically translated by Original news
In the first trimester of the 2011 traffic goods in the port of Venice it is diminished of 2.2%
In increase the goods several. The bulk drops. Emphasized increase of the passengers
May 2, 2011
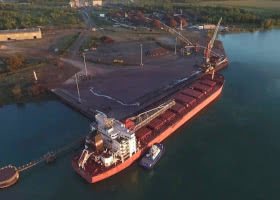
In the first trimester of this year the traffic of the goods in the port of Venice is diminished altogether of 2.2% attesting itself to 6,3 million tons regarding 6,4 million tons in the first three months of 2010.
The contraction of the volume total is determined by the decrease of the bulk sand banks, that they are piled to 1,3 million tons (- 20.3%), and from less the most emphasized bending of the liquid bulk, that they are come down of 1.3% to about 3,0 million tons.
In increase, instead, the goods several that - with a total of 2,1 million tons - has grown of 11.9% regarding the first trimester last year. The goods containerized pairs to 1,1 million tons (+26,5 have been), with a handling of the container pairs to 112.894 teu (+32.1%). The goods conventional is increased of 2.1% to 564 thousand tons, while the rotabili are diminished of 4.8% to 408 thousand tons.
In the field of the passengers the traffic has been of beyond 73 thousand unit (+48.1%), of which 45 thousand crocieristi (+167.7%).
In the single freedom of expression the 2011 total traffic has been of 2.083.666 tons, down of 10.8% regarding March 2010. The liquid bulk is diminished of 20.9% to 945.509 tons and the solid bulk has recorded a bending of 9.7% to 425.102 tons. The goods several is increased of 6.2% to 713.055 tons.
Port of Venice Statistics of the traffic (Fonte: Harbour authority of Venice)
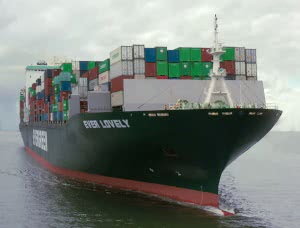
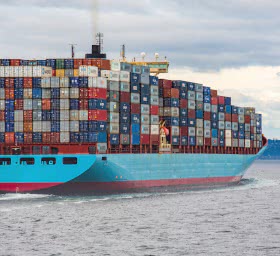
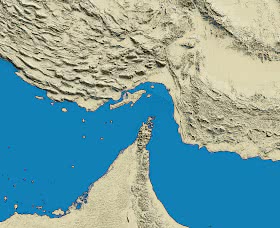
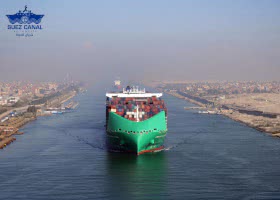
The Suez Canal Authority has announced that it will introduce surcharges on transit tariffs through the Egyptian canal for most major cargo vessels, effective July 15.
- Via Raffaele Paolucci 17r/19r - 16129 Genoa - ITALY
phone: +39.010.2462122, fax: +39.010.2516768, e-mail
VAT number: 03532950106
Press Reg.: nr 33/96 Genoa Court
Editor in chief: Bruno Bellio No part may be reproduced without the express permission of the publisher


 In the first trimester of this year the traffic of the goods in the port of Venice is diminished altogether of 2.2% attesting itself to 6,3 million tons regarding 6,4 million tons in the first three months of 2010.