|
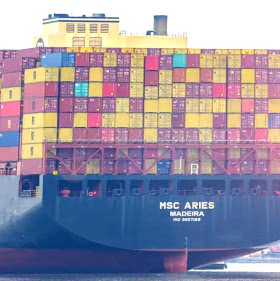
As its name implies, the cargo of PCTCs is not limited to new or second-hand cars alone. Broadly speaking, the cargo carried by PCTCs on deepsea routes nowadays typically includes about 50% new or second-hand cars and 50% (better-paying) "high and heavy" or "out of gauge" cargo. The latter is mainly being carried on ballast legs (i.e. on their way back to the car loading areas) and can include a whole myriad of different cargoes such as agricultural machines, construction equipment, wind mills, helicopters, etc. On some trades (e.g. to the Eastern Mediterranean or West-Africa) vast volumes of second-hand cars are shipped.
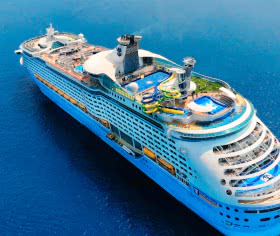
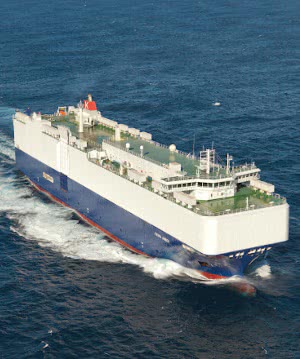
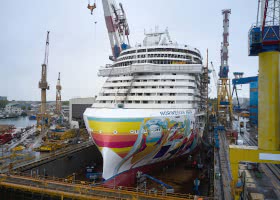
From a technical point of view the PCTC with 10-14 cargo decks, of which 4 or 5 hoistable ones, is nowadays the true workhorse in the industry. Many of the recently built PCTCs have a ramp capacity of 150 tons or more, clearly reflecting the increasing importance of "high and heavy" cargoes. In contrast to PCTCs, the Pure Car Carrier (PCC) concept is slowly fading away, due to a number of reasons. Firstly, the clear height of their car decks is not high enough to accommodate mono-volume cars or SUVs, which are becoming increasingly popular among consumers. Moreover, PCCs are far less suited than PCTCs to carry the mix of cargo types mentioned above.
|
24 |
Of course not all of the 80 million manufactured vehicles will have to be transported overseas. Nevertheless, some industry pundits estimate that the car carrying trades could involve as much as 20 million units by 2010, when China and other emerging markets in Asia are expected to generate substantial regional and global export flows. |
|
25 |
This is the minimum size considered competitive for long-haul trades. |
|
26 |
The oldest car carriers in the current world fleet are two units built in 1973. One of them is still used to carry second-hand vehicles from Europe to the Middle East and Africa, while the other is being circulated for sale by its Maltese owners. Car carriers can nowadays indeed continue trading to an age of 30 years or more, because rolling cargo on rubber tyres does not cause much hull damage, coupled with the fact that ballast tanks and engines onboard ships can be renewed. The improved quality of coatings also plays a role in this respect. |
|
27 |
Out of the 50 or so major car manufacturers worldwide, only five have their own vessels to handle export cargoes, namely Nissan Motor (Nissan Motor Car Carrier), Volkswagen (Volkswagen Logistics), Toyota (Toyofugi), Honda (Act Marine) and Hyundai Motor (Eukor). The size of their ship fleets is, however, not sufficient to meet 100% of their shipment needs, implying that they have to rely on other operators as well. In fact, many car manufacturers have long-standing relationships with PCTC operators. |
|
28 |
The total export volume of Japanese new cars reached an estimated 5.6 million units in 2006, a substantial 19% increase over 2005. For China, the total export volume of new cars reached about 340,000 units in 2006, a massive 96% increase over 2005. On the import side, China accounted for 229,000 units in 2005, about 40% more than the year before. Contrary to their Japanese or South Korean counterparts, Chinese manufacturers have to rely on foreign car carrier operators for the shipment of vehicles, because local shipping companies only own RoRo vessels that are deployed on coastal routes. This constitutes an important reason behind the plans of China to establish its own car carrier fleet, although this will take a number of years to materialize. |
|
|
In order to keep up with an expected annual 2% growth in vehicle manufacturing in the coming decade (to reach an estimated 80 million units by 2015), many operators have invested heavily in the expansion of their ship fleets24. At the end of 2006 about 570 car carriers with a capacity of at least 1000 car equivalent units (CEU) were being deployed on worldwide trade routes (never before was the fleet so big) for a combined capacity of about 2.6 million CEU. At that time, a further 160-180 units were on order for delivery during 2007-2010, for a total capacity of nearly 1 million CEU. In recent years prices for PCTC newbuildings have increased steadily: the typical price tag for a 6500 CEU unit ordered at established Japanese or South Korean yards nowadays reaches about USD 75-80 million, while this was just USD 55 million a few years ago. However, shipyards in emerging markets such as Vietnam (Vinashin) or India (Pipavav) nowadays offer more attractive prices.
Although representing some 35% of the current fleet capacity in CEU terms, it is generally assumed that the 1 million CEU order backlog, which is heavily focused towards 6000+ CEU vessels, will easily be absorbed by the market. Indeed, according to some industry observers the market is nowadays (i.e. early 2007) characterized by a shortage of car carrier tonnage of about 10%. This corresponds with roughly 50 ships in the 2000+ CEU segment25. This tight supply situation has a number of important implications. Firstly, according to some industry observers, shipments of new cars from Japan or South Korea are nowadays being delayed by about 1 month on average. Secondly, the lack of capacity has resulted in the fact that many older vessels, which have reached an age at which they could be scrapped, are actually still trading. In fact, just one single car carrier went to the scrapping yard in 2005, while in 2006 no such ship was scrapped at all.
Because of this extremely low scrapping activity in recent years, the car carrier fleet nowadays counts more than 100 vessels of over 25 years old26. Unsurprisingly, these ships are mainly used to transport second-hand cars, as they do not boast the necessary deck configuration or ramp capacity to carry a mix of vehicles and "high and heavy" cargo. Other important markets for older car carriers are the trades between Japan and New Zealand, between the Mediterranean/North Europe and West Africa, and between the Far East and Middle East. It is generally assumed that the older vessels will gradually be phased out as from 2010 onwards, i.e. after the large newbuildings slated for 2007-2010 delivery have poured into the market.
A final implication of the tight supply situation is the fact that charter rates for car carriers have increased significantly in recent years. Current 12-month charter rates for 5000-6000 CEU units are estimated to be in the USD 30,000-40,000 per day region, i.e. about double the rate level of three years ago. In fact, the increases in newbuild prices and charter rates have been much more pronounced than the increase in freight rates obtained from shippers/manufacturers who, following consolidation in the car manufacturing industry, nowadays have substantial bargaining power vis-à-vis operators27. This fact, combined with spiralling fuel costs, has obviously put PCTC operators under significant pressure in recent times. Yet, as manufacturers are well aware of the current tight supply situation and high fuel costs, they are prepared to put freight rates and bunker clauses back up for discussion at the negotiation table. After all, for many of them ocean transport constitutes a vital part of their global supply chains. In fact, as a result of the tight supply situation at the end of 2006, some car manufacturers have signed longer-term contracts than usual with car carrier operators, in order to safeguard required space (Nightingale, 2007).
3.1.1.3 Leading car carrier operators
On the shipping lines side, the industry is dominated by about six major operators based in the Far East and Europe, the largest of them being Japanese NYK (Table 26). This carrier currently has an (owned or controlled) car carrier fleet of some 90 vessels for a combined capacity of some 400,000 CEU and shipped an estimated 3.2 million CEU during 2006, an increase of about 15% compared to 200528. Driving forces behind the growth in NYK cargo volumes were (and still are) the increasing interest from the North American market for fuel-efficient Japanese cars, as well as good sales in Europe and the Middle East. Apart from NYK, other big deepsea players are Mitsui OSK Lines, K-Line, Eukor, Wallenius Wilhelmsen Logistics and Höegh Autoliners (including Maersk tonnage). These six carriers nowadays directly own about half of the specialist car carrier capacity and operate more than 80% of global fleet capacity (when chartered tonnage is included). Moreover, each of these six companies is also heavily involved in the European shortsea trades (cf. infra). Table 26 also clearly illustrates the dominance of the Japanese "Big Three" (NYK, K-Line and MOL) on the car carrying market. The "Others" line in Table 26 mainly refers to tonnage suppliers. The main players in this segment are Cido Shipping, Ray Car Carriers, Gram Car Carriers, Zodiac Maritime, Vroon and Dyvi. Just like the big operators, these tonnage providers have invested heavily in newbuilding orders in recent years.
In order to supply their global networks, the large vehicle manufacturers are nowadays increasingly obliged to use the services of all these six independent companies, rather than appointing one or two single carriers to carry all their business. In fact, "established relationships from the past have given way to contracts based on the need to supply different trade flows with different carriers. These contracts often imply cargo sharing agreements between carriers" (Drewry Shipping Consultants, 2006:45).
Table 26: Leading car carrier operators as at July 2006
|
Operator |
Vessels
owned |
Capacity
(CEU) |
Vessels
operated |
Capacity
(CEU) |
|
NYK |
54 |
264,000 |
85 |
393,000 |
|
Eukor |
24 |
124,000 |
>85 |
>350,000 |
|
K-Line |
30 |
145,000 |
77 |
344,000 |
|
MOL |
51 |
235,000 |
>70 |
>320,000 |
|
WWL |
37 |
195,000 |
50 |
264,000 |
|
Hoegh |
27 |
142,000 |
50 |
220,000 |
|
Others |
354 |
1,212,000 |
- |
- |
|
Total |
577 |
2,359,000 |
577 |
2,359,000 |
Source: Drewry Shipping Consultants (2006)
Another major player in the car carrier industry is Italy-based Grimaldi, which is both an operator and tonnage provider. From a geographical point of view, Grimaldi is a special case in point in that it currently mainly focuses on the Mediterranean-North Europe, intra-Mediterranean, Europe-West Africa and Europe-East Coast South America trade routes. As such, it has not (yet) ventured outside the Atlantic for vehicle transport. Secondly, United European Car Carriers (UECC) and K-Line European Sea Highway Service (KESS) are peculiar cases as they are heavily involved in the shorter-haul feedering business for the main deepsea operators (see below). So also here a parallel with the container liner industry can be drawn.
From an operational point of view, in the mid-nineties a fleet of 25-30 ships was regarded as the threshold needed to have the scale and flexibility to serve the car manufactures. The general expectation is that this figure will have tripled to around 80 units by 2010. This probably constitutes an important reason behind the recent team-up between Höegh Autoliners and AP Moller Maersk, which involves a joint commercial management of their respective fleets. The combined Höegh and Maersk fleet consists of 55 + 12 vessels (including chartered tonnage), with a further 15 units to be delivered during the next couple of years. Höegh Autoliners carried about 1.8 million CEU in 2006, of which some 65% consisted of new cars. While the AP Moller Maersk Line fleet (consisting of small 2500 CEU and mid-sized 4800 CEU units) is currently chartered out to Wallenius Wilhelmsen Logistics, NYK and Mitsui OSK Lines, it is expected that most of the vessels will join the Höegh fleet once their charter commitments expire.
3.1.1.4 Vehicle trades in Europe
|
29 |
The Russian vehicle market is expected to reach 2 million units by 2010. The port of Kotka in Finland is increasingly being used as the gateway to Russia, with vehicles being transported to St-Petersburg and Moscow. In fact, Kotka is one of the seven strategic ports where Wallenius Wilhelmsen Logistics operates its own terminals, next to Zeebrugge, Southampton, Liverpool, Baltimore, Brunswick and Port Hueneme (the latter three being located in the United States of America). |
|
30 |
As a matter of fact, demand for new cars in Russia is so high that in the course of 2006 a number of modern RoRo vessels of Transfennica were grabbed by UECC. They are now being converted to shortsea car carriers. |
|
31 |
The port of Copenhagen/Malmö (CMP) is rapidly developing as a Nordic hub for cars. The volume of new cars handled at CMP terminals increased from 160,000 units in 2003 to no less than 350,000 units in 2005. This represents an average annual increase of nearly 50%. |
|
32 |
In North America, the main ports of call for new and second-hand vehicle trades include New York (1 million units in 2005), Fraserport (Canada), Baltimore, Portland, Jacksonville, Brunswick, Los Angeles, Port Hueneme and Long Beach. In the Far East, the principal hub ports are Hong Kong, Laem Chabang (Thailand), Sriracha (Thailand), Singapore, Shanghai, Tianjin, Yokohama and Toyohashi. |
|
|
As far as the European market is concerned, maritime transport of cars is expected to increase steadily over the years to come, following stable or slightly increasing demand for cars in the mature Northwest European market coupled with strong growth in Russia29, Eastern Europe and Turkey. This latter aspect is expected to boost the import flow of cars in ports in the Baltic and the Black Sea. It will also be to the benefit of intra-European shortsea carriers, because many ports in the Baltic or the Black Sea currently dispose of insufficient draught to handle the large PCTCs, such that they have to be served by transhipment via large ports in the Mediterranean such as, for example, Gioia Tauro. Similarly, Russian volumes30 could be transshipped via Bremerhaven in Germany to, e.g., Kotka in Finland. Of course, this picture would change drastically when car manufacturers would decide to establish factories in Eastern Europe and Russia.
As outlined above, the leading deepsea car carrier operators are also heavily involved in the intra-European shortsea trades. Examples include United European Car Carriers (UECC) which is jointly owned by Wallenius and NYK; K-Line European Sea Highway Service (KESS); Autoliners SAS (a subsidiary of Höegh Autoliners); Euro Marine Carriers (in which Höegh has a minority share); and the European shortsea operations by MOL. This combination of deepsea and regional service provision is part of the general trend towards the "one stop shop/total service logistics package" which operators now have to provide to vehicle manufacturers to retain their business (Drewry Shipping Consultants, 2006).
In more mature European markets, for example the English Channel traffic, car carriers are nowadays facing very strong competition from traditional RoRo operators (such as Cobelfret from Belgium), although the RoRo operators' main business still remains the transport of trucks, trailers and mafis so their ships have relatively limited car capacities. Cobelfret is a particular case in point. Following the commissioning of the massive 4600 lanem PAULINE in 2006, coupled with a consolidation of its terminal interests (Cobelfret owns terminals in Purfleet, Killingholme, Rotterdam, Zeebrugge and Vlissingen), the company can remain ahead of competition from other RoRo operators, as well as feeder lines and shortsea car carriers (ShipPax Information, 2007).
Table 27 provides an overview of the main European ports handling new and second-hand cars. In some of these ports, car carrier operators have invested in dedicated hub terminals from which other destinations are feederised, although a typical roundtrip for a large PCTC nowadays still counts five or six ports in Europe. Apart from the ports listed in Table 27, other important car handling ports which receive regular PCTC calls are Livorno (Leghorn), Flushing (Vlissingen), Vigo, Valencia, Piraeus, Koper, Santander, Göteborg, Copenhagen/Malmö31, Marseilles, Pasajes, Almeria, Rotterdam, Ghent and Cuxhaven. Some of these ports are situated in close proximity to car assembly factories of leading manufacturers32.
Table 27: Main European vehicle ports in 2005
|
Port |
units (m) |
Port |
units (m) |
|
Zeebrugge |
1.73 |
Sheerness* |
0.67 |
|
Bremerhaven |
1.65 |
London* |
0.67 |
|
Emden |
0.86 |
Grimsby/Immingham |
0.62 |
|
Antwerp |
0.81 |
Bristol/Portbury |
0.60 |
|
Barcelona |
0.78 |
Le Havre |
0.58 |
|
Southampton |
0.71 |
Tyne Ports |
0.48 |
Source: Port Authorities. Various
* 2004 figure
3.1.2 Deepsea - Liner trades with RoRo-facilities
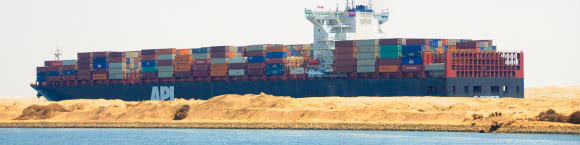
From an operational point of view, the ConRo concept (which refers to the carriage of containers and RoRo cargo on one single ship) bears a big resemblance with container liner shipping. Cargoes transported include new and second-hand cars, trucks, "high and heavy" cargo and containers. Important shipping lines in the ConRo market segment are Grimaldi Lines, Delmas/OTAL and Nile Dutch Shipping (NDS).
In the past, the deployment of ConRo vessels was very popular on certain liner trades to the Middle East, West Africa, South America and Russia, where facilities to handle ships were rather limited in certain ports. As for today, the ConRo concept has almost completely faded away on the deepsea routes (e.g. to/from the Middle East). It does, however, still survive on certain Western African and South-American trades (e.g. Grimaldi), as well as in the Levant (Beirut/Tripoli). ConRo vessels are nowadays also being deployed on some shortsea routes, by such carriers as Transfennica (Spliethoff Group) or Cobelfret.
|
33 |
Grimaldi Lines ordered five ConRo vessels (25,000 dwt, 800 teu, 2000 cars and 250 trucks) at Hyundai Mipo for a reported USD 430 million in early 2007. The vessels will be delivered in 2010-2011 and come on top of five similar units ordered earlier in Croatia. |
|
|
Most of today's ConRo vessels were built in the seventies and eighties, so the fleet has reached a relatively high average age. Construction of new vessels has come to an almost complete standstill as, with the exception of Grimaldi Lines (Naples) (which also owns transatlantic ConRo line ACL), nobody seems willing to invest in new tonnage33. This has led to a decreased presence of ConRo tonnage on liner trades.
Grimaldi Lines also has a number of dedicated terminals around Europe suited to handle ConRo cargoes, e.g. in Naples, Antwerp and Hamburg. To conclude, it should be mentioned that the United States (for their Naval Reserve Fleet) have absorbed quite a number of ConRo vessels from the market, to deploy them in times of international conflict.
3.1.3 Shortsea - Ferries
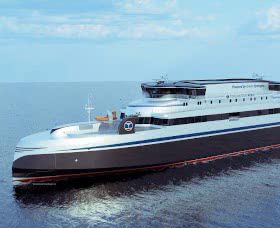
Whereas in the past the main income of ferry operators was related to the transport of passengers (income could typically be broken down into 35-40% "passengers", 35-40% "duty free" and 25-30% "freight"), this picture has undergone a fundamental change in recent years. First of all, ferry operators have been and are still faced with increasing competition from low-cost airlines (which nowadays offer cheap flights throughout entire Europe) and passenger and freight services between the Continent and the UK via the Channel Tunnel. This was compounded by the abolishment of duty-free sales onboard ferries in Europe on 1 July 1999, which resulted in a substantial loss of passenger traffic. On the other hand, freight transport in Europe has enjoyed very high growth rates in recent years.
In view of the above, it is not surprising to see that many ferry operators have felt the need to substitute passenger space for freight space onboard their vessels. As a case in point, SeaFrance's latest ferries nowadays carry about 120 trucks per voyage between Calais and Dover, compared to 40-50 for vessels of a previous generation. Another example is the Travemünde-Trelleborg service operated by TT-Line. After the abolishment of duty-free sales, TT-Line decided to order new ships with a higher focus on freight and with only very basic passenger facilities (in the past passenger facilities onboard TT-Line ships were much more developed). In addition, Stena Line decided to have its cruise-ferries on the Kiel-Göteborg link rebuilt, to allow for an increase in the freight capacity and a more flexible exploitation of passenger facilities (e.g. less crew in the Winter season and more crew in the Summer holiday season). Another case in point is ferry operator Finnlines, who is introducing ferries with a freight capacity of about 4200 lanemetre and several hundred passengers on the link between Travemünde (North Germany) and Finland. These ferries will temporarily be the largest ferries deployed on European trade routes.
Hence, the general tendency in today's ferry market is clear - an increasing focus on freight (which has indeed now become the main revenue for most ferry operators in Europe) rather than passengers. Having said this, however, passenger transport still remains a very important business for certain ferry operators on certain markets. A prime example of this is the Sweden-Finland link. Another exception to the increasing focus on freight is formed by the "cruise-ferries" which only carry about 1300-1500 lanemetre of freight. As an example we can mention the cruise ferries of Color Line deployed between Kiel (Germany) and Oslo.
In addition to the traditional services in Northern and Western Europe, another market worth mentioning is the Mediterranean, which has witnessed a tonnage rejuvenation in recent years. The traffic is very much "North-South" oriented rather than "East-West", with large ferries being deployed on services linking e.g. Northern Italy with Sicily, Italy with Greece, and France with Corsica or North Africa. Service speed is a crucial issue in these markets, and several ferry operators are nowadays deploying conventional RoPax vessels with speeds of up to 30 knots. To some extent, this phenomenon of fast conventional RoPax ferries is being copied in Northern Europe. As a case in point, Color Line will soon be introducing fast conventional vessels replacing ageing passenger RoRo vessels on services linking Denmark with Norway.
Finally, other important ferry links are Germany/Sweden, Denmark/Sweden, England-Wales/Ireland, England/Scandinavia, Calais/Dover, Valencia/Barcelona to the islands and North Africa, Marseilles/Corsica and North Africa, Sicily/Sardinia, Greece, the Adriatic Sea and Tunisia/Algeria/Morocco. Generally speaking, all these markets are being characterized by an increasing focus on freight transport (and thus a reduced focus on passenger transport), less duty-free sales and the deployment of faster and more modern ships.
Table 28 provides an overview of world ferry traffic in 2005 for passengers and three types of cargo. As this table indicates, Europe accounts for about one third of global passenger traffic by ferries, but its share of commercial ferry cargoes is much higher. The Baltic is a very important market for car and bus traffic, while the North Sea area is the dominant geographical region for trailer traffic.
Table 28: World ferry traffic in 2005
|
Area |
Passengers |
Cars |
Buses |
Trailers |
Trips |
|
Baltic |
187,182,008 |
67,816,38 |
305,106 |
6,926,465 |
3,569,383 |
|
Mediterranean |
192,195,725 |
26,551,362 |
85,131 |
6,578,501 |
351,432 |
|
North Sea |
131,772,903 |
18,786,155 |
275,265 |
10,100,708 |
315,830 |
|
Subtotal Europe |
511,150,636 |
113,153,898 |
665,502 |
23,605,674 |
4,236,645 |
|
Rest of world |
883,964,931 |
43,295,710 |
86,015 |
4,878,016 |
1,404,400 |
|
World total |
1,395,115,567 |
156,449,608 |
751,517 |
28,483,690 |
5,641,045 |
|
Share of Europe |
36.6% |
72.3% |
88.6% |
82.9% |
75.1% |
Source: ShipPax Statistics & Outlook 2006
At 01/01/2006, the total number of ferries amounted to 1,162 units, with a combined capacity of 1.16 million passengers (of which some 320,000 accommodated in cabins), 266,210 cars or 769,210 lanemetres of commercial vehicles. The fleet had a combined Gross Tonnage (GT) of 12,816,377 GT and an average age of 21 years. As Table 29 indicates, the top-15 European ferry operators accounted for just over half the GT of the total ferry fleet.
Table 29: Top-15 European ferry operators at 01/01/2006
|
Company |
Total GT |
Company |
Total GT |
|
DFDS Group |
925,167 |
Scandlines |
349,274 |
|
Stena |
834,359 |
Tallink |
347,914 |
|
P&O |
572,082 |
ANEK Lines |
328,243 |
|
Tirrenia di Navigazione |
549,565 |
Silja Line |
317,313 |
|
Grandi Navi Veloci |
443,181 |
SNCM Ferryterranee |
264,645 |
|
Color Line |
424,613 |
Viking Line |
246,032 |
|
Superfast Ferries |
388,184 |
Total top-15 |
6,740,270 |
|
Trasmediterranea |
381,405 |
Total ferry fleet |
12,816,377 |
|
Minoan Lines |
368,293 |
Share of top-15 |
52.6% |
Source: ShipPax Statistics & Outlook 2006
3.1.4 Shortsea - Unaccompanied freight transport
The market for unaccompanied freight transport, the fourth of the RoRo markets discussed here, is "booming business" for all players involved in it, and for most geographical regions is being characterized by scale increases (larger vessels), a shortage of vessels and a rather old age profile of the fleet. Vessels active in these trades are only allowed to carry a maximum of 12 drivers.
The market for unaccompanied freight transport is of crucial importance to many ports in Scandinavia, through which substantial
volumes of paper and forest products from local manufacturers (such as Stora Enso, UPM Kymmene, SCA or Norske Skog) are exported. Many of these export cargoes are loaded on mafis and then transported via RoRo vessels to destinations all across Europe. However, in order to reduce their dependency on pure RoRo freight, many shipping lines also increasingly reserve space for containers, for example for northbound cargoes going back to Scandinavia (e.g. 600-700 teu on the new Transfennica vessels). Important shipping lines in the Scandinavian RoRo market include DFDS Tor Line, Transfennica (Spliethoff Group) and Finnlines.
Another major market for unaccompanied RoRo freight transport is the North Sea, for example from Benelux ports (Rotterdam (Europoort and Hoek van Holland), Flushing, Zeebrugge and Ostend) to ports along the Humber and Thames (Hull, Killingholme, Dartford, Purfleet, Dagenham and Immingham). Other important UK ports are the so-called "Haven Ports" of Felixstowe (Norfolkline), Harwich (Stena Line) and Ipswich (Ferryways). On the North Sea market, containerized cargo is playing an increasingly important role (e.g. Cobelfret already carries more containers than trailers on some of its North Sea services). Without a doubt, the container will increase its penetration on other trade routes than the North Sea as well.
In contrast to the two above-mentioned markets (i.e. Scandinavia and North Sea), the market between North Europe and the Mediterranean is a very difficult market for unaccompanied RoRo transport, due to the very heavy competition from road transport. As a matter of fact, volumes on the North Europe to Mediterranean trade are nowadays not yet sufficient for a cost-effective exploitation of services with a high frequency (which is a crucial aspect if one wants to compete head-on with road transport). As a result, services on this trade route are only viable if they enjoy financial support such as under the "Motorways of the Seas" programme of the European Commission.
Finally we have the intra-Mediterranean market, but this market is nowadays more focussed towards RoPax vessels, while trailer transport is only of secondary importance. In the intra-Mediterranean market, UN RORO offers very specific concepts between Italy and Turkey (2 RoRo sailings per day between Trieste and Istanbul).
3.2 RoRo traffic handled in European seaports
Table 30 provides an overview of RoRo traffic handled in a selection of European seaports. The table was drawn from a large Eurostat database containing about 260 ports handling RoRo traffic, for a total throughput of 415 million tons in 2005. However, for the present Report we have limited ourselves to those seaports which handled at least 200,000 tons of RoRo traffic. This resulted in a total ports sample of about 160 individual ports spread across 22 different countries, as shown in Table 30. Their combined RoRo throughput amounted to 407 million tons in 2005, effectively representing 98% of the total RoRo throughput of the 260 ports in the Eurostat database.
As can be seen from Table 30, ports in the United Kingdom handled nearly 100 million tons of RoRo traffic in 2005, i.e. about one quarter of the total RoRo traffic handled in European seaports. Next, with a total traffic of more than 50 million tons, Italy is also a major import/export country for RoRo cargo in Europe, although none of its ports handled more than 8 million tons of RoRo traffic in 2005. Other important players on the European RoRo handling scene are Sweden, Germany, Belgium, Denmark, France, Greece, Spain, the Netherlands, Finland and Ireland, each handling more than 0 million tons in 2005. Between them, these 12 countries handled about 391 million tons of RoRo traffic in 2005, giving them a combined market share of nearly 95%.
On an individual port basis, the biggest RoRo port in Europe is Dover, with a total traffic of more than 20 million tons in 2005. This represents about 5% of the combined RoRo throughput of the 260 ports in the Eurostat database. Other major RoRo ports, handling more than 10 million tons per year, include Calais (France), Zeebrugge (Belgium), Lübeck (Germany), Immingham (UK), Rotterdam (the Netherlands), Trelleborg and Göteborg (Sweden). At the other end of the spectrum, more than 160 European seaports handled less than 1 million tons of RoRo traffic in 2005.
As Table 30 indicates, the Eurostat database makes a distinction between two kinds of RoRo cargo, namely mobile self-propelled units on the one hand and other (non-self-propelled) RoRo cargo on the other. These two categories correspond to Codes 5 and 6, respectively, as defined in Annex II of Council Directive 95/64/EC of 8 December 995 on statistical returns in respect of carriage of goods and passenger by sea, as modified by Commission Decision 2005/366/EC of March 2005 (see OJ L123 of 17/5/2005 page 5).
The first RoRo category (mobile self-propelled units) includes (1) road goods vehicles and accompanying trailers, (2) passenger cars, motorcycles and accompanying trailers/caravans, (3), passenger buses, (4) trade vehicles (including import/export motor vehicles), (5) live animals on the hoof, and (6) other mobile self-propelled units. The total throughput in the selected European ports amounted to some 243 million tons in 2005. The United Kingdom was by far the market leader with a cargo volume exceeding 50 million tons, followed by Sweden (26.8 million tons), France (22.5 million tons) and Germany (21.4 million tons). On an individual port basis, Dover was by far the biggest port, followed by Calais, Rotterdam, Trelleborg, Lübeck, Rostock and Rodby.
The second RoRo category (non self-propelled cargo) includes (1) unaccompanied road goods trailers and semi-trailers, (2) unaccompanied caravans and other road, agricultural and industrial vehicles, (3) rail wagons, shipborne port-to-port trailers, and shipborne barges engaged in goods transport, and (4) other mobile non-self-propelled units. Here, the total throughput reached about 172 million tons in 2005. The United Kingdom was again by far the market leader with a cargo volume of nearly 50 million tons, followed by Italy (32 million tons), Belgium (20.4 million tons), Germany (15.3 million tons) and Sweden (13.9 million tons). On an individual port basis, Zeebrugge was the biggest port for this type of RoRo cargo, followed by Immingham, Lübeck, London, Göteborg and Genova.
Table 30: Overview of RoRo traffic handled in European seaports (2005)
|
Port |
Self-prop, |
Other |
RoRo total |
Port |
Self-prop, |
Other |
RoRo total |
|
Zeebrugge |
2,426,461 |
13,579,949 |
16,006,410 |
Palma Mallorca |
4,601,149 |
2,603,848 |
7,204,997 |
|
Oostende |
3,827,212 |
2,360,556 |
6,187,768 |
Barcelona |
2,707,849 |
1,145,977 |
3,853,826 |
|
Antwerp |
1,893,961 |
3,484,103 |
5,378,064 |
Santa Cruz de Tenerife |
376,503 |
1,291,282 |
1,667,785 |
|
Ghent |
75,955 |
1,007,948 |
1,083,903 |
Las Palmas |
137,621 |
1,494,515 |
1,632,136 |
|
Belgium |
8,223,589 |
20,432,556 |
28,656,145 |
Cádiz |
83,642 |
1,411,754 |
1,495,396 |
|
Varna |
456,369 |
|
456,369 |
Algeciras |
976,474 |
49,978 |
1,026,452 |
|
Other Bulgarian ports |
85,114 |
|
85,114 |
Ceuta |
307,380 |
472,876 |
780,256 |
|
Bulgaria |
541,483 |
0 |
541,483 |
Tarragona |
593,212 |
102,218 |
695,430 |
|
Rødby (Færgehavn) |
5,240,900 |
|
5,240,900 |
Santander |
498,525 |
33,074 |
531,599 |
|
Helsingør (Elsinore) |
4,282,510 |
|
4,282,510 |
Melilla |
133,963 |
385,235 |
519,198 |
|
Århus |
1,818,656 |
1,551,328 |
3,369,984 |
Vigo |
471,248 |
|
471,248 |
|
Kalundborg |
1,859,567 |
1,131,520 |
2,991,087 |
Málaga |
79,193 |
302,274 |
381,467 |
|
Frederikshavn |
2,401,566 |
243,780 |
2,645,346 |
Almería |
114,927 |
260,628 |
375,555 |
|
Esbjerg |
93,527 |
1,667,608 |
1,761,135 |
Pasajes |
311,016 |
19,072 |
330,088 |
|
Gedser |
1,447,100 |
|
1,447,100 |
Alicante |
12,363 |
239,348 |
251,711 |
|
Hirtshals |
1,177,068 |
|
1,177,068 |
Other Spanish ports |
129,340 |
88,304 |
217,644 |
|
Rønne |
174,830 |
208,427 |
383,257 |
Spain |
11,534,405 |
9,900,383 |
21,434,788 |
|
Københavns Havn |
216,939 |
150,564 |
367,503 |
Calais |
16,555,458 |
|
16,555,458 |
|
Køge |
119,506 |
182,710 |
302,216 |
Marseille |
491,717 |
1,475,319 |
1,967,036 |
|
Aabenraa |
: |
263,873 |
263,873 |
Cherbourg |
1,456,821 |
759 |
1,457,580 |
|
Fredericia (Og Shell) |
29,088 |
181,958 |
211,046 |
Caen |
1,398,724 |
|
1,398,724 |
|
Denmark |
18,861,257 |
5,581,768 |
24,443,025 |
Le Havre |
1,312,903 |
174 |
1,313,077 |
|
Lübeck |
6,062,021 |
9,650,269 |
15,712,290 |
Dieppe |
661,098 |
|
661,098 |
|
Rostock |
5,287,150 |
1,894,134 |
7,181,284 |
Nantes Saint-Nazaire |
203,747 |
94,144 |
297,891 |
|
Puttgarden |
3,734,777 |
|
3,734,777 |
Rouen |
239,665 |
754 |
240,419 |
|
Sassnitz |
461,167 |
2,010,181 |
2,471,348 |
Other French ports |
149,477 |
206,265 |
355,742 |
|
Bremerhaven |
2,328,577 |
77,959 |
2,406,536 |
France |
22,469,610 |
1,777,415 |
24,247,025 |
|
Kiel |
778,573 |
761,365 |
1,539,938 |
Genova |
753,985 |
6,582,507 |
7,336,492 |
|
Emden |
1,422,066 |
|
1,422,066 |
Livorno |
1,822,881 |
4,944,340 |
6,767,221 |
|
Cuxhaven |
289,484 |
799,050 |
1,088,534 |
Olbia |
1,056,584 |
3,849,479 |
4,906,063 |
|
Hamburg |
371,069 |
11,373 |
382,442 |
Trieste |
1,372,991 |
1,832,042 |
3,205,033 |
|
Other German ports |
644,939 |
73,516 |
718,455 |
Cagliari |
270,085 |
2,757,512 |
3,027,597 |
|
Germany |
21,379,823 |
15,277,847 |
36,657,670 |
Palermo |
1,065,643 |
1,689,242 |
2,754,885 |
|
Tallinn |
3,099,223 |
1,637,419 |
4,736,642 |
Napoli |
1,275,415 |
1,171,894 |
2,447,309 |
|
Kunda |
|
828,149 |
828,149 |
Taranto |
1,879 |
2,293,199 |
2,295,078 |
|
Pärnu |
|
1,350,663 |
1,350,663 |
Ancona |
2,057,855 |
146,509 |
2,204,364 |
|
Vene-Balti |
|
218,778 |
218,778 |
Civitavecchia |
583,360 |
1,460,334 |
2,043,694 |
|
Estonia |
3,099,223 |
4,035,009 |
7,134,232 |
Salerno |
1,563,162 |
294,628 |
1,857,790 |
|
Dublin |
4,255,551 |
4,107,980 |
8,363,53 |
Piombino |
1,151,119 |
650,149 |
1,801,268 |
|
Other Irish ports |
2,478,816 |
974,125 |
3,452,941 |
Venezia |
927,165 |
583,648 |
1,510,813 |
|
Ireland |
6,734,367 |
5,082,105 |
11,816,472 |
Messina |
1,209,373 |
239,705 |
1,449,078 |
|
Pireus |
3,247,269 |
1,525,330 |
4,772,599 |
Catania |
325,149 |
760,184 |
1,085,333 |
|
Patras |
2,947,729 |
612,731 |
3,560,460 |
Trapani |
765,069 |
176,481 |
941,550 |
|
Igoumenitsa |
2,745,158 |
24,339 |
2,769,497 |
Bari |
858,241 |
43,611 |
901,852 |
|
Antirio |
2,242,389 |
|
2,242,389 |
Brindisi |
773,036 |
35,752 |
808,788 |
|
Rio |
2,242,389 |
|
2,242,389 |
Porto Torres |
144,013 |
660,624 |
804,637 |
|
Heraklio |
934,180 |
962,944 |
1,897,124 |
Termini Imerese |
43,842 |
755,599 |
799,441 |
|
Paloukia Salaminas |
1,867,352 |
|
1,867,352 |
Ravenna |
9,134 |
529,494 |
538,628 |
|
Perama |
1,867,352 |
|
1,867,352 |
Monfalcone |
74,294 |
395,180 |
469,474 |
|
Corfu |
630,891 |
574 |
631,465 |
Other Italian ports |
740,273 |
125,640 |
865,913 |
|
Megara |
382,925 |
|
382,925 |
Italy |
18,844,548 |
31,977,753 |
50,822,301 |
|
Rhodes |
254,573 |
23,236 |
277,809 |
Dover |
20,124,272 |
540,898 |
20,665,170 |
|
Other Greek ports |
260,910 |
75,785 |
336,695 |
Immingham |
1,782,985 |
10,897,124 |
12,680,109 |
|
Greece |
19,623,117 |
3,224,939 |
22,848,056 |
London |
998,436 |
7,991,937 |
8,990,373 |
|
Limassol (Lemesos) |
118,666 |
92,044 |
210,710 |
Liverpool |
2,595,607 |
3,627,928 |
6,223,535 |
|
Other Cypriotic ports |
12,574 |
281 |
12,855 |
Larne |
2,830,000 |
2,599,160 |
5,429,160 |
|
Cyprus |
131,240 |
92,325 |
223,565 |
Belfast |
1,971,851 |
2,730,667 |
4,702,518 |
|
Liepaja |
437,076 |
82,762 |
519,838 |
Hull |
1,151,303 |
2,751,417 |
3,902,720 |
|
Ventspils |
512,073 |
3,345 |
515,418 |
Holyhead |
3,088,472 |
693,987 |
3,782,459 |
|
Other Latvian ports |
57 |
|
57 |
Portsmouth |
2,812,491 |
910,104 |
3,722,595 |
|
Latvia |
949,206 |
86,107 |
1,035,313 |
Harwich |
1,510,771 |
2,117,632 |
3,628,403 |
|
Klaipeda |
847,660 |
851,567 |
1,699,227 |
Heysham |
466,859 |
2,841,742 |
3,308,601 |
|
Lithuania |
847,660 |
851,567 |
1,699,227 |
Cairnryan |
2,186,882 |
1,087,051 |
3,273,933 |
|
Malta (Valetta) |
22,552 |
181,999 |
204,551 |
Felixstowe |
236,439 |
2,633,963 |
2,870,402 |
|
Other Maltese ports |
|
698 |
698 |
Tees & Hartlepool |
172,427 |
2,468,084 |
2,640,511 |
|
Malta |
22,552 |
182,697 |
205,249 |
Ramsgate |
1,618,105 |
224,371 |
1,842,476 |
|
Rotterdam |
9,599,793 |
1,380,999 |
10,980,792 |
Fleetwood |
563,524 |
1,071,611 |
1,635,135 |
|
Scheveningen |
3,328,675 |
|
3,328,675 |
Southampton |
1,451,730 |
99,576 |
1,551,306 |
|
Vlissingen |
1,735,405 |
|
1,735,405 |
Stranraer |
1,046,564 |
118,538 |
1,165,102 |
|
Amsterdam |
309,873 |
14,411 |
324,284 |
Milford Haven |
535,679 |
541,047 |
1,076,726 |
|
Other Dutch ports |
191,908 |
|
191,908 |
Ipswich |
98,593 |
968,885 |
1,067,478 |
|
Netherlands |
15,165,654 |
1,395,410 |
16,561,064 |
Poole |
813,492 |
226,405 |
1,039,897 |
|
Swinoujscie |
2,239,819 |
489,760 |
2,729,579 |
Warrenpoint |
87,253 |
766,250 |
853,503 |
|
Gdynia |
1,022,976 |
530,024 |
1,553,000 |
Bristol |
718,955 |
123,253 |
842,208 |
|
Other Polish ports |
124,916 |
70,548 |
195,464 |
Tyne |
649,766 |
165,726 |
815,492 |
|
Poland |
3,387,711 |
1,090,332 |
4,478,043 |
Fishguard |
380,015 |
133,310 |
513,325 |
|
Setúbal |
368,442 |
3,678 |
372,120 |
Forth |
256,109 |
217,830 |
473,939 |
|
Other Portuguese ports |
71,240 |
2,794 |
74,034 |
Medway |
396,840 |
|
396,840 |
|
Portugal |
439,682 |
6,472 |
446,154 |
Aberdeen |
24,265 |
232,018 |
256,283 |
|
Romanian ports |
22,579 |
188,683 |
211,262 |
Other UK ports |
331,979 |
127,988 |
459,967 |
|
Romania |
22,579 |
188,683 |
211,262 |
United Kingdom |
50,901,664 |
48,908,502 |
99,810,166 |
|
Slovenian ports |
20,266 |
8,380 |
28,646 |
Split |
628,705 |
534 |
629,239 |
|
Slovenia |
20,266 |
8,380 |
28,646 |
Other Croatian ports |
49,225 |
928 |
50,153 |
|
Helsinki |
2,129,028 |
2,905,656 |
5,034,684 |
Croatia |
677,930 |
1,462 |
679,392 |
|
Turku |
1,388,132 |
1,456,548 |
2,844,680 |
Stavanger Ports* |
2,039,775 |
253,661 |
2,293,436 |
|
Hanko |
949,024 |
1,342,313 |
2,291,337 |
Haugesund Ports* |
1,314,947 |
37,607 |
1,352,554 |
|
Naantali |
1,996,235 |
80,542 |
2,076,777 |
Oslo |
534,271 |
678,690 |
1,212,961 |
|
Hamina |
22,555 |
331,616 |
354,171 |
Porsgrunn Ports* |
208,048 |
352,526 |
560,574 |
|
Kotka |
82,621 |
188,496 |
271,117 |
Larvik |
455,376 |
|
455,376 |
|
Uusikaupunki |
23,734 |
210,994 |
234,728 |
Kristiansand S |
283,679 |
105,300 |
388,979 |
|
Vaasa |
153,533 |
66,592 |
220,125 |
Sandefjord |
298,279 |
|
298,279 |
|
Other Finnish ports |
7,178 |
90,960 |
98,138 |
Other Norwegian ports |
287,443 |
300,908 |
588,351 |
|
Finland |
6,752,040 |
6,673,717 |
13,425,757 |
Norway |
5,421,818 |
1,728,692 |
7,150,510 |
|
Trelleborg |
7,554,054 |
3,003,534 |
10,557,588 |
|
|
|
|
|
Göteborg |
3,248,685 |
6,948,616 |
10,197,301 |
|
|
|
|
|
Helsingborg |
3,824,864 |
616,098 |
4,440,962 |
|
|
|
|
|
Malmö |
2,806,163 |
1,077,756 |
3,883,919 |
|
|
|
|
|
Stockholm |
1,660,304 |
1,033,197 |
2,693,501 |
|
|
|
|
|
Kappelskär |
2,481,841 |
101,380 |
2,583,221 |
|
|
|
|
|
Ystad |
1,957,836 |
501,204 |
2,459,040 |
|
|
|
|
|
Karlshamn |
881,551 |
279,631 |
1,161,182 |
|
|
|
|
|
Karlskrona |
931,836 |
32,551 |
964,387 |
|
|
|
|
|
Nynäshamn (ports) |
442,177 |
252,658 |
694,835 |
|
|
|
|
|
Varberg |
658,788 |
6,136 |
664,924 |
|
|
|
|
|
Umeå |
217,515 |
11,375 |
228,890 |
|
|
|
|
|
Other Swedish ports |
105,166 |
64,013 |
169,179 |
|
|
|
|
|
Sweden |
26,770,780 |
13,928,149 |
40,698,929 |
Total all ports |
242,822,204 |
172,432,270 |
415,254,474 |
Source: Eurostat
Overview of main developments in the European RoRo market during 2006
|
Development of the RoRo fleet in 2006
According to Clarkson Research Services Ltd, the total RoRo fleet (including RoRo/Freight/Passenger vessels, RoRo/LoLo vessels, full-RoRo vessels, ConRo vessels and PC(T)Cs) reached 1673 units at the end of 2006 for a combined capacity of 18.13 million dwt. This represents a 4.8% increase compared to the beginning of the year (1618 vessels for 17.3 million dwt). The combined orderbook for all above-mentioned vessel types at the end of 2006 counted 226 vessels for a combined capacity of some 3.5 million dwt. Only a handful of RoRo vessels were sent to the scrapyards during 2006.
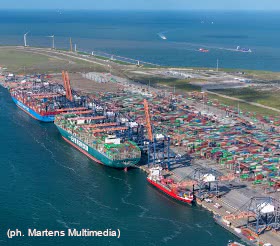
Port/terminal development in Europe (non-exhaustive)
Despite declaring that its core interests when acquiring Hesse-Noord Natie (HNN) in 2002 were Containers and RoRo traffic, PSA reached an agreement with NYK at the end of 2006 regarding the transfer of the RoRo activities of PSA HNN to NYK. The agreement concerns both the terminal operations (one terminal in Antwerp and two in Zeebrugge) and the PDI activities. The take-over fits in NYK's strategy to develop existing port infrastructure and thus ensure the continuity of maritime vehicle transport. The deal was officially concluded in mid-February 2007 and the new company will operate under the name International Car Operators (ICO). The terminals in Zeebrugge and Antwerp handled a combined volume 1.3 million units in 2006.
Grimaldi Naples is reportedly looking to strengthen its RoRo terminal activities in the Mediterranean. Existing terminals in Civitavecchia, Monfalcone, Salerno and Valencia are involved, as well as a new facility in Barcelona. Apart from these Mediterreanean terminals, Grimaldi also has stakes in RoRo/multipurpose terminals in Antwerp (Antwerp Euro Terminal, its North European hub) and Hamburg (through an early-2007 acquired 49% stake in HHLA's Unikai terminal).
DFDS Tor Line switched most of its operations in Immingham (UK) to the Nordic Riverside Terminal at the Immingham Outer Port, for which they have a 25-year exclusive use. Vanuden RoRo reportedly intends to use this terminal as its hub for Scandinavia/Baltic cargo on its RoRo/multipurpose service between Europe and the Eastern Mediterranean.
Hafen-Entwicklungsgesellschaft Rostock developed the berth 60 on the Warnow quay into a RoRo berth by removing the old container bridges at the site (January-August 2006).
In April, 2006, CCI Boulogne announced a '20m investment in a new RoRo berth, due into service in June 2007, dedicated to fast jet cargo carriers.
In early 2006 the ports of Dover and Calais announced plans to cater for major increases in RoPax ferry traffic, estimated at around '200m and '300-400m respectively. Dover handled a record > 2m freight vehicles in 2005. Calais, which accounted for 1.6m heavy-goods vehicles that year, plans to create a new outer port. Apart from catering for more Dover-Calais traffic, the port authority (CCI Calais) wants to diversify and attract new (unaccompanied) RoRo services from Spain, the Baltic, etc. The new development will be directly rail-linked. In 2006 the port of Calais invested effectively in the new facilities and improved the security and safety measures to meet the demands of the ferry operators and their customers. The port achieved a record throughput of 1,847,197 trucks in 2006.
In the port of Bilbao, vehicle handling company Termicar Bilbao moved to a new site in the Bilbao Outer Abra zone. The new terminal boasts a 900m quay length and two ramps for RoRo vessels. It comprises a 27ha yard and has rail and road connections.
The Port of Warnemunde commissioned a new passenger terminal in May 2006, complementing the existing Warnemunde Cruise Center.
Similarly, the port of Sillamae (Estonia) commissioned a new passenger terminal in August 2006.
Other significant developments (non-exhaustive)
Generally speaking, trailer traffic is expected to increase by some 4-5% per year in the established markets, with even higher growth rates in the emerging markets. According to some observers, this might well lead to orders for 7500+ lanem vessels in the not too distant future. This will obviously have massive implications for port facilities handling them.
- Although 2006 saw the contracting of the world's biggest RoPax (2 x 5500 lanem vessels for Stena Line) and cruise vessels (Royal Caribbean's "Genesis" class), shipyards in the Far East currently have such huge order backlogs for other types of tonnage (notably container vessels and dry and liquid bulk carriers) that their interest in building RoPax and cruise vessels has vanished. Moreover, the number of manufacturing locations for large and medium-speed engines (which are crucial to the ferry market) have been reduced to just three, creating a capacity bottleneck. As a result, there is currently a 36-month lead-time between contract signing and vessel delivery in the RoRo segment.
- SeaContainers, the once giant passenger shipping company, was dissolved in 2006. Another victim was Fjord Line, which sold off its UK line to DFDS Seaways. On the other hand, Tallink swallowed Silja Line and Superfast's Baltic activities while Grimaldi took control of Finnlines in late 2006. Similarly, LD Lines tendered successfully for the operation hitherto provided by Transmanche Ferries while the service of the already defunct DANE Sea Lines was acquired by Blue Star Ferries.
- Just like the container industry, the ferry sector aroused an increased interest of risk capitalists and equity funds, casting their eyes on Scandlines, SNCM, Moby Lines and Grandi Navi Veloci. This marks an important change in the history of ferry shipping, where merger and acquisition activity used to take place within the established shipping businesses.
- Norfolkline (at the time still owned by AP Moller-Maersk) and Flota Suardiaz set up the joint venture Norfolkline-Suardiaz BV in early 2006, with the intention to start a Dunkirk-Northern Spain service with 200-trailer capacity RoRo vessels. For this project the European Commission reserved USD 5.1 million of Marco Polo support. Norfolkline already offers RoRo ferry services between the North Continent and the UK, while Flota Suardiaz started a two-vessel RoRo link between Le Havre, Setubal, Casablanca and Santa Cruz de Tenerife.
- Cido Car Carriers commenced a monthly southbound RoRo service from Antwerp and Sheerness to East Africa in July 2006, deploying 3000 CEU vessels.
- Cosco Shipping Company (Coscol) concluded a 15-year contract with no less than 17 Chinese car makers for the carriage of their vehicles worldwide (starting with domestic, Russia, Middle East and Latin America flows). Coscol will substantially invest in a PCC and PCTC fleet expansion.
- At the RoRo 2006 conference in Ghent (May 2006) Stena Line announced that they would soon commission ConRoPax vessels, i.e. a combination of container feeder vessel (250 TEU) and a 2100 lanem RoRo ship with accommodation for 300 passengers.
- The AS Tallink Group acquired from Attica (Greece) the 3 x 30 knot RoPax Ferries SUPERFAST VIII, SUPERFAST IX and SUPERFAST X in early 2006, for a total amount of USD 383 million. The route on which the ships are deployed (Hanko-Paldiski-Rostock) is part of the deal.
- A new Italian domestic RoRo service has been set up between the Port of Augusta, in the south east of Sicily, and the north Adriatic Port of Ravenna in early 2006. Departures will be every four days in each direction. The line has been launched by BMMS Motorway Mediterranean Sea. A chartered vessel, the 193m LOA MAERSK VOYAGER is deployed in the service. The ship has a capacity for approximately 185 unaccompanied trailers and accommodation for up to 12 drivers. Complete vehicles and containers will be accepted, as well as dangerous goods and oversized project cargoes.
- During 2006 the first steps were undertaken to privatise German/Danish Scandlines AG (at that time still 50% Danish Ministry of Transport / 50% Deutsche Bahn owned). In early 2007 two take-over candidates were still in the running, i.e. venture capitalist 3i and Baltic Freight Ferry Development (comprising Allianz Capital and Deutsche Seereederei). It is unclear when the final decision will be taken. Scandlines AG operates 24 ferries on 12 Baltic RoRo services (in the Denmark-Germany-Sweden triangle and to the Baltic countries) and carried just over 1 million lorry units in 2006, a 3.3% increase compared to the year before. The number of rail wagons decreased 12% to 88,000 units. Scandlines also carried about 20 million passengers and 4.2 million cars in 2006.
Source: Dynamar (2006, 2007), ShipPax Information (2007) and various trade press articles
|
BACK TO INDEX
|