Nel primo semestre di quest'anno il gruppo olandese Vopak ha realizzato un utile netto di 94,5 milioni di euro, con un incremento del 21% sullo stesso periodo del 2000. Al positivo risultato, annunciato oggi, seguirà invece - secondo le previsioni della Vopak - un secondo semestre in flessione, tanto che l'utile netto a fine 2001 è stimato analogo a quello dello scorso anno (160,1 milioni di euro). Secondo Vopak infatti, in base a recenti dati, in Nord America e in Europa proseguirà il rallentamento dell'economia e l'incertezza sulle previsioni di ripresa del settore manifatturiero. Nel primo semestre di quest'anno il gruppo olandese Vopak ha realizzato un utile netto di 94,5 milioni di euro, con un incremento del 21% sullo stesso periodo del 2000. Al positivo risultato, annunciato oggi, seguirà invece - secondo le previsioni della Vopak - un secondo semestre in flessione, tanto che l'utile netto a fine 2001 è stimato analogo a quello dello scorso anno (160,1 milioni di euro). Secondo Vopak infatti, in base a recenti dati, in Nord America e in Europa proseguirà il rallentamento dell'economia e l'incertezza sulle previsioni di ripresa del settore manifatturiero.
Nei primi sei mesi di quest'anno il fatturato netto è stato di 3 miliardi di euro (+42%), mentre l'EBITA si è attestato sui 199,6 milioni di euro (+29%).
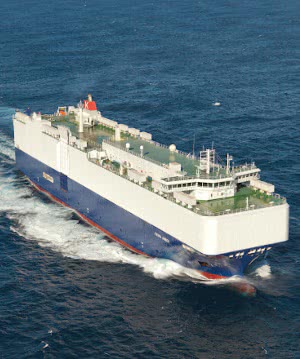
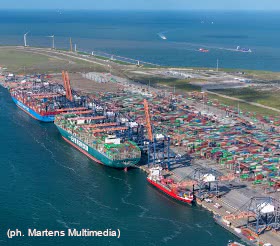
Il gruppo ha registrato buoni risultati nel core business dello stoccaggio e della logistica dei prodotti chimici ed ha proseguito la dismissione delle attività marittime, che attualmente rappresentano il 14% del giro d'affari del gruppo, contro il 20% lo scorso anno. Vopak ha intenzione di portare questa percentuale al di sotto del 10%.
| In EUR millions | 2001 H1
| 2000 H1 | % |
| Net sales | 3,004.1 | 2,108.2 | 42.5 |
| Group operating income before amortization of goodwill (EBITA) | 199.6 | 154.7 | 29.0 |
| Net income for ordinary shareholders before amortization of goodwill* | 94.5 | 78.2 | 20.8 |
| Earnings per ordinary share before amortization of goodwill* | 1.87 | 1.49 | 25.5 |
| Earnings per ordinary share after amortization of goodwill* | 1.68 | 1.49 | 13.0 |
* before extraordinary results
(Source: Vopak)Consolidated income statement
| in EUR millions | First half year
|
| | 2001 | 2000
|
| | | |
| Net sales | 3,004.1 | 2,108.2 |
| Other operating income | 3.1 | -0.8 |
| Total operating income | 3,007.2 | 2,107.4 |
| | | |
| Cost of sales | -2,109.9 |
-1,407.4 |
| Gross margin | 897.3 | 700.0 |
| | | |
| Wages, salaries and social security charges | 358.1 | 271.2 |
| Depreciation | 83.0 | 67.9 |
| Other operating expenses | 292.1 | 233.0 |
| Total operating expenses | 733.2 | 572.1 |
| | | |
| Operating income | 164.1 |
127.9 |
| | | |
| Income from equity participations | 35.5 | 26.8 |
| Group operating income before amortization of goodwill (EBITA) | 199.6 | 154.7 |
| | | |
| Amortization of goodwill | -9.5 | - |
| Group operating income after amortization of goodwill (EBIT) | 190.1 | 154.7 |
| | | |
| Net interest expense | -51.2 | -23.0 |
| Income from ordinary activities before income taxes | 138.9 | 131.7 |
| | | |
| Income taxes | -45.5 | -42.9 |
| Income from ordinary activities after income taxes | 93.4 | 88.8 |
| | | |
| Extraordinary income after taxes | 9.4 | - |
| Consolidated net income | 102.8 | 88.8 |
| | | |
| Third-party interest in consolidated net income | -4.1 | -6.3 |
| Net income | 98.7 | 82.5 |
| | | |
| Dividend on cumulative financing preference shares | -4.3 | -4.3 |
| | | |
| Net income for holders of common shares |
94.4 | 78.2 |
| | | |
| Earnings per share (before amortization of goodwill)* | 1.87 | 1.49 |
| | | |
| Fully diluted earnings per share (before amortization of goodwill)* | 1.87 | 1.48 |
| | | |
| Earnings per share (after amortization of goodwill)* | 1.68 | 1.49 |
| | | |
| Fully diluted earnings per share (after amortization of goodwill)* | 1.68 | 1.48 |
* before extraordinary results
(Source: Vopak)Consolidated balance sheet
| in EUR millions | 30-06-2001
| 31-12-2000 | 30-06-2000
|
| | | | | | | |
| Intangible fixed assets | 391.2 | | - | | - | |
| Tangible fixed assets | 1,851.5 | | 1,681.3 | | 1,597.1 | |
| Financial fixed assets | 438.9 | | 600.7 | |
467.0 | |
| Total fixed assets | | 2,681.6 | | 2,282.0 | | 2,064.1 |
| | | | | | | |
| Inventories | 512.4 | | 348.4 | | 350.4 | |
| Accounts receivable | 1,312.8 | | 865.8 | |
888.4 | |
| Prepaid expenses and accrued income | 89.5 | | 91.1 | |
96.9 | |
| Securities | 15.0 | | 15.5 | | 16.6 | |
| Cash and cash equivalents | 153.0 | | 115.9 | |
164.1 | |
| Total current assets | |
2,082.7 | | 1,436.7 | | 1,516.4 |
| | | | | | | |
| Amounts owed to banks | 202.2 | | 161.3 | |
203.2 | |
| Current portion of long-term debt | 138.7 | | 109.9 | |
174.8 | |
| Trade accounts and other accounts payable |
1,348.2 | | 955.1 | | 1,020.9 | |
| Dividends | 4.4 | | 74.2 | | 4.4 | |
| Total current liabilities | | 1,693.5 | | 1,300.5 | | 1,403.3 |
| | | | | | | |
| Current assets less current liabilities |
| 389.2 | | 136.2 | | 113.1 |
| | | | | | | |
| Total assets less current liabilities | | 3,070.8 | | 2,418.2 | | 2,177.2 |
| | | | | | | |
| Long-term debt | | 1,501.8 | | 1,095.8 | | 782.3 |
| | | | | | | |
| Provision for deferred tax liabilities |
166.7 | | 134.6 |
| 113.5 | |
| Provision for pensions | 38.8 | | 33.1 | |
29.9 | |
| Other provisions | 240.0 |
| 160.2 | | 205.4 | |
| Total Provisions | | 445.5 | | 327.9 | |
348.8 |
| | | | | | | |
| Third-party interests | 43.0 | | 37.2 | |
46.2 | |
| Stockholders' equity | 1,080.5 | | 957.3 | |
999.9 | |
| Group equity | | 1,123.5 | | 994.5 | |
1,046.1 |
| Total | | 3,070.8 | | 2,418.2 | | 2,177.2 |
| | | | | | | |
| Ratios | | | | | | |
| | | | | | | |
| Return on average capital employed | | 12.0% | | 12.6% | | 12.8% |
| Current assets: current liabilities | | 1.2 | | 1.1 |
| 1.1 |
| Interest cover (EBITDA: net interest) | | 5.5 | | 8.5 |
| 9.7 |
| Solvency (including subordinated loans) |
| 24.6% | | 28.1% | | 30.8% |
(Source: Vopak)Consolidated statement of cash flows
| in EUR millions | First half year
|
| | 2001 |
2000 |
| | | | | |
| Net income | 98.7 | | 82.5 | |
| | | | | |
| Adjustments for: | | | | |
| Depreciation and amortization | 92.5 | | 67.9 | |
| Movements in provisions | 32.2 | | 0.3 | |
| Movements in third-party interests | 3.9 | | 4.4 | |
| Retained income from equity participations |
49.7 | | -12.8 |
|
Gain on sale of property, plant, equipment,
group companies and equity participations | -37.1 | | 0.8 | |
Movements in working capital (excluding
cash and cash equivalents, short-term credit
and dividend) | -33.0 | | -32.4 | |
| Net cash flow from operating activities |
| 206.9 | | 110.7 |
| | | | | |
| Net investment: | | | | |
| Property, plant and equipment | -85.1 | | -106.1 | |
| Financial fixed assets | 2.0 | | -10.0 | |
| Group companies (including goodwill) | -341.8
| | 66.2 | |
| Net cash flow from investing activities |
| -424.9 | | -49.9 |
| | | | | |
| Financing : | | | | |
| Net movements in long-term debt and short-term financing | 274.5 | | 115.2 | |
| Repurchase of shares in own capital | - | | -45.0 | |
| Issued to holders of option rights | 7.5 | | 2.1 | |
| Dividend distribution | -71.8 | | -69.4 | |
| Net cash flow from financing activities |
| 210.2 | | 2.9 |
| | | | | |
| Net cash flow | | -7.8 | | 63.7 |
| | | | | |
| Exchange and translation differences | | 4.2 | | 1.9 |
| Movements in cash and cash equivalents owing to consolidations and deconsolidations | | 40.7 | |
-.02 |
| Increase in cash and cash equivalents | | 37.1 | | 65.4 |
(Source: Vopak)Review of results in 2001 Half Year
Operating income by activity
Oil & Gas Logistics
| in EUR millions | 2001 H1 |
2000 H1 | 2000 |
| Net sales | 145.7 | 139.0 | 292.3 |
| EBITA (earnings before interest, tax and amortization of goodwill) | 65.3 | 53.5 | 115.0 |
| Average capital employed incl. goodwill |
528.6 | 526.6 | 548.2 |
| Return on capital employed* | 24.7% | 20.3% | 21.0% |
* including goodwill excluding amortization of goodwill
(Source: Vopak)Chemicals Logistics
| in EUR millions | 2001 H1
| 2000 H1 | 2000
|
| Net sales | 249.9 | 229.4 | 468.2 |
| EBITA (earnings before interest, tax and amortization of goodwill) | 66.7 | 53.0 | 111.3 |
| Average capital employed incl. goodwill |
1,045.3 | 955.3 | 973.2 |
| Return on capital employed* | 12.8% | 11.1% | 11.4% |
* including goodwill excluding amortization of goodwill
(Source: Vopak)Chemical Distribution North America
| in EUR millions | 2001 H1
| 2000 H1 | 2000 |
| Net sales | 1,712.1 | 1,188.7 | 2,301.2 |
| EBITA (earnings before interest, tax and amortization of goodwill) | 48.8 | 36.3 | 71.7 |
| Average capital employed incl. goodwill |
1,085.7 | 542.9 | 586.5 |
| Return on capital employed* | 9.0% | 13.4% | 12.2% |
* including goodwill excluding amortization of goodwill
(Source: Vopak)Chemical Distribution Europe
| in EUR millions | 2001 H1
| 2000 H1 | 2000
|
| Net sales | 881.3 | 538.3 | 1,063.0 |
| EBITA (earnings before interest, tax and amortization of goodwill) | 23.1 | 15.4 | 17.4 |
| Average capital employed incl. goodwill |
580.3 | 285.9 | 301.0 |
| Return on capital employed* | 7.9% | 10.8% | 5.8% |
* including goodwill excluding amortization of goodwill
(Source: Vopak)
|
|