Quotidiano indipendente di economia e politica dei trasporti
05:03 GMT+2
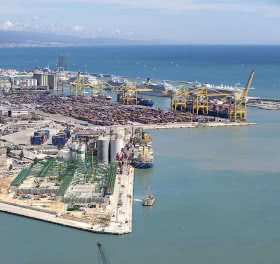
Nel 2004 il traffico marittimo mondiale delle merci è ammontato a 6,76 miliardi di tonnellate (+4,3%)
Per il 2005 è prevista una crescita analoga. La capacità di carico della flotta mondiale è aumentata del 4,5%
7 novembre 2005
Nel 2004 il traffico marittimo mondiale delle merci è ammontato a 6,76 miliardi di tonnellate, con un incremento del 4,3% rispetto all'anno precedente. Lo rileva il rapporto Review of Maritime Transport 2005 presentato oggi dall'UNCTAD (United Nations Conference on Trade and Development), nel quale viene osservato come la crescita sia risultata minore rispetto a quella del 2003 quando l'incremento fu del 5,8%. Per il 2005 l'UNCTAD prevede una crescita del 4,3% circa del traffico marittimo mondiale.
Lo scorso anno la maggior parte delle esportazioni di merci via mare è avvenuta dall'Asia (38,4%), mentre le nazioni europee hanno rappresentato il 22,7% dell'export marittimo, l'America il 21,4%, l'Oceania l'8,9% e l'Africa l'8,6%.
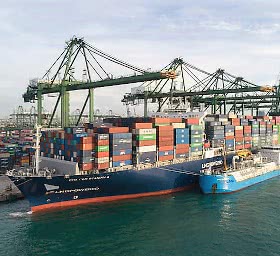
Il 2004 è stato un anno positivo per i noli, in crescita sia nel trasporto tramp che in quello di linea. Aumenti rilevanti sono stati registrati sia nel trasporto di rinfuse liquide che di rinfuse secche; i noli del trasporto containerizzato hanno totalizzato aumenti ad una cifra e alla fine del 2004 sono risultati superiori a quelli di fine 2003.
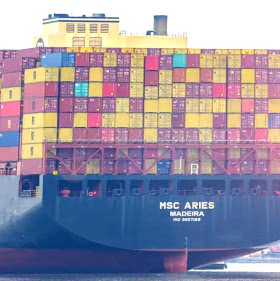
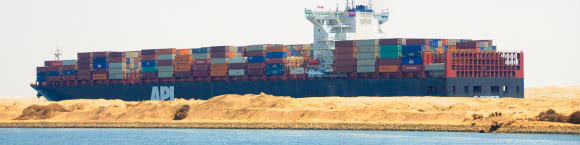
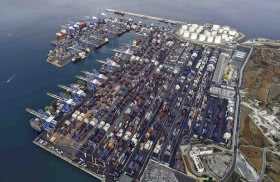
Lo scorso anno i volumi trasportati di rinfuse liquide sono aumentati del 4,2% e i volumi di rinfuse secche sono cresciuti del 4,4% (l'incremento in questo settore è stato determinato dalla progressione dei volumi delle principali voci merceologiche che hanno compensato una flessione delle altre rinfuse secche). Per quanto riguarda i traffici containerizzati il dato è relativo al 2003, quando la movimentazione dei container nei porti mondiali è aumentata del 9,6% raggiungendo la quota record di 303,1 milioni di teu rispetto ai 276,6 milioni di teu movimentati nel 2002; per il 2004 è prevista una crescita analoga in considerazione del fatto che i primi 20 porti del mondo hanno totalizzato una movimentazione di 166,62 milioni di teu (144,40 milioni di teu nel 2003).
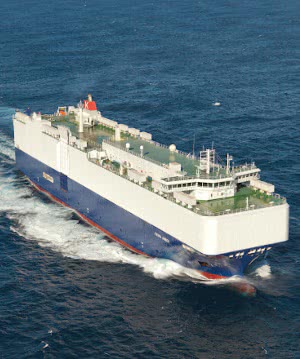
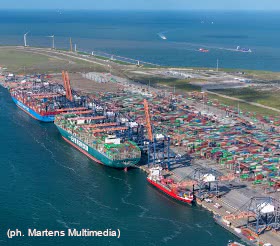
Nel 2004 è proseguita anche la crescita della capacità della flotta mondiale, salita del 4,5% a 895.843.000 tonnellate di portata lorda al 31 dicembre scorso (856,9 milioni di tpl al 31 dicembre 2003). Nel corso del 2004 le consegne di nuove navi sono ammontate a 49,4 milioni di tonnellate di portata lorda (+0,2 milioni di tpl rispetto all'anno precedente). Le navi cisterna e le portarinfuse rappresentano il 73,3% della capacità della flotta mondiale (al 31 dicembre 2004); la capacità della flotta di portacontainer è cresciuta dell'8,4% a 98,1 milioni di tpl, raggiungendo il 10,9% della capacità della flotta mondiale.
Development of international seaborne trade, selected yearsa (goods loaded)
Year
Tanker cargo
Dry cargo
Total (all goods)
Total
of which main bulk commoditiesb
Million tons
% change
million tons
% change
million tons
% change
million tons
% change
1970
1442
1124
448
2566
1980
1871
1833
796
3704
1990
1755
2253
968
4008
2000
2163
3821
1288
5983
2001
2177
0.7
3844
0.6
1331
3.3
6020
0.6
2002
2146
-1.4
3981
3.6
1352
1.6
6127
1.8
2003
2223
3.6
4257
6.9
1475
9.1
6480
5.8
2004c
2316
4.2
4442
4.4
1587
7.6
6758
4.3
Source: Estimated by the UNCTAD secretariat on the basis of annex II and data supplied by specialized sources. a Includes international cargoes loaded at ports of the Great Lakes and St. Lawrence system for unloading at ports of the same system. b Iron ore, grain, coal, bauxite/alumina and phosphate. c Estimates.
World seaborne trade a in 1970, 1980, 1990 and 2000-2004, by types of cargo and country groups b
Country group
Year
Goods loaded
Goods unloaded
Oil
Dry cargo
Total all goods
Oil
Dry cargo
Total all goods
Crude
Products c
Crude
Products c
Trade in millions of tons
World total
1970
1109
232
1162
2504
1101
298
1131
2529
1980
1527
344
1833
3704
1530
326
1823
3679
1990
1287
468
2253
4008
1315
466
2365
4126
2000
1665
498
3821
5983
1728
542
4003
6273
2001
1678
499
3844
6020
1712
534
3954
6201
2002
1637
509
3981
6127
1696
540
4099
6335
2003
1690
533
4257
6480
1743
536
4324
6603
2004
1770
546
4442
6758
1773
545
4469
6787
Percentage share of trade by country groups
World total
1970
42.6
12.7
44.7
100.0
43.5
11.9
44.6
100.0
1980
41.2
9.3
49.5
100.0
41.6
8.9
49.5
100.0
1990
32.1
11.7
56.2
100.0
31.9
10.8
57.3
100.0
2000
27.8
8.3
63.9
100.0
27.5
8.6
63.8
100.0
2001
27.9
8.3
63.8
100.0
27.6
8.6
63.8
100.0
2002
26.7
8.3
65.0
100.0
26.8
8.5
64.7
100.0
2003
26.1
8.2
65.7
100.0
26.4
8.1
65.5
100.0
2004
26.2
8.1
65.7
100.0
26.1
8.0
65.8
100.0
DMECs
1970
2.0
27.1
60.0
31.1
80.4
79.6
79.1
79.9
1980
6.3
25.5
64.7
37.0
72.0
79.5
67.8
70.5
1990
13.4
32.6
63.4
43.8
72.5
81.4
61.7
67.3
2000
5.2
22.2
60.6
42.0
68.3
52.0
60.4
61.8
2001
5.3
22.5
58.8
40.9
68.7
51.6
59.5
61.4
2002
5.4
23.1
57.4
40.7
67.8
50.9
58.0
60.0
2003
5.3
22.3
54.6
39.1
67.9
50.9
57.2
59.5
2004
5.1
22.7
54.4
38.9
67.6
50.9
56.4
58.9
Central and Eastern Europe d
1970
3.4
8.0
6.9
5.6
1.2
1.0
3.8
2.3
1980
3.6
14.6
5.2
5.4
2.3
0.4
6.0
4.0
1990
4.6
11.8
3.8
5.0
2.6
0.3
5.8
4.1
2000
5.5
8.9
4.1
4.9
0.5
0.4
1.9
1.4
2001
5.4
8.0
4.2
4.9
0.5
0.0
1.6
1.2
2002
5.6
8.2
4.4
5.0
0.6
0.6
1.6
1.3
2003
6.9
8.2
4.2
5.2
0.6
0.6
1.5
1.2
2004
7.0
8.1
4.0
5.1
0.6
0.6
1.5
1.2
Socialist countries of Asia e
1970
-
-
1.2
0.5
0.5
0.1
2.0
1.2
1980
1.4
1.7
1.0
1.2
1.4
1.6
4.0
2.7
1990
2.7
0.9
2.0
2.0
0.3
0.3
3.4
2.1
2000
1.0
1.1
6.5
4.6
4.1
4.1
7.2
6.1
2001
1.0
1.1
6.9
4.8
3.5
5.0
8.0
6.5
2002
1.1
2.1
7.3
5.2
4.1
4.7
9.1
7.4
2003
1.1
2.3
8.6
6.1
5.0
5.5
10.3
8.5
2004
1.2
2.6
9.4
6.7
5.6
6.1
11.4
9.4
Developing countries
1970
94.6
64.9
31.9
62.8
17.9
19.4
15.1
16.6
1980
88.7
58.2
29.0
56.3
24.3
18.5
22.3
22.8
1990
79.6
54.7
30.8
49.2
24.6
18.0
29.1
26.5
2000
88.3
67.8
28.7
48.6
27.2
43.6
30.5
30.7
2001
88.3
68.4
30.0
49.4
27.3
43.4
30.9
31.0
2002
87.9
66.5
30.9
49.1
27.6
43.8
31.4
31.4
2003
86.7
67.2
32.7
49.6
26.6
43.0
30.9
30.8
2004
86.7
66.6
32.2
49.3
26.3
42.5
30.7
30.5
of which: Africa
1970
25.5
2.4
9.1
15.2
1.7
4.7
3.6
2.9
1980
19.0
1.5
5.6
10.8
4.0
2.9
4.7
4.2
1990
24.1
7.6
4.3
11.2
5.6
2.3
4.3
4.5
2000
17.9
6.9
1.6
6.6
3.2
3.2
3.3
3.3
2001
17.7
7.0
1.7
6.6
2.9
3.2
3.5
3.3
2002
17.8
6.8
1.6
6.4
2.9
3.2
3.4
3.2
2003
17.8
6.8
1.5
6.2
2.9
3.2
3.2
3.1
2004
17.7
6.8
1.5
6.2
2.9
3.2
3.2
3.1
Americas
1970
12.2
35.4
13.8
16.0
10.5
5.6
4.4
7.2
1980
12.4
28.4
13.2
14.3
13.3
4.9
5.4
8.7
1990
13.3
11.9
13.2
13.1
5.7
3.8
4.0
4.5
2000
15.2
18.8
10.5
12.5
5.5
9.9
5.3
5.7
2001
15.3
18.6
10.8
12.7
5.6
9.5
5.1
5.6
2002
16.0
18.4
11.1
13.0
5.6
9.8
5.0
5.6
2003
14.7
19.6
12.8
13.9
5.6
8.9
5.3
5.7
2004
14.5
19.3
12.4
13.5
5.5
8.9
5.2
5.6
Asia
1970
56.9
27.0
8.1
31.3
5.5
8.5
6.7
6.4
1980
57.3
28.1
9.7
31.0
6.9
9.8
12.0
9.7
1990
42.2
34.9
12.6
24.7
12.6
10.9
19.9
16.6
2000
54.9
41.6
16.2
29.1
18.1
29.0
21.5
21.2
2001
55.0
42.3
17.1
29.7
18.4
29.2
21.9
21.6
2002
53.8
40.8
17.7
29.3
18.6
29.3
22.6
22.1
2003
53.9
40.4
17.9
29.1
17.7
29.3
22.0
21.5
2004
54.3
40.0
17.9
29.2
17.4
28.8
22.0
21.3
Europe
1970
-
-
-
-
-
0.1
0.1
-
1980
-
-
-
-
-
0.2
-
-
1990
-
0.2
0.3
0.2
0.7
0.5
0.8
0.7
2000
0.0
0.4
0.4
0.3
0.4
0.4
0.3
0.3
2001
0.0
0.4
0.4
0.3
0.4
0.4
0.3
0.3
2002
0.0
0.4
0.4
0.3
0.4
0.4
0.3
0.3
2003
0.0
0.4
0.4
0.3
0.4
0.4
0.3
0.3
2004
0.0
0.4
0.4
0.3
0.4
0.4
0.2
0.3
Oceania
1970
-
0.1
0.8
0.4
-
0.5
0.3
0.2
1980
-
0.2
0.5
0.2
0.1
0.7
0.2
0.2
1990
-
0.1
0.4
0.2
-
0.5
0.1
0.2
2000
0.2
0.0
0.1
0.1
0.0
1.1
0.1
0.2
2001
0.2
0.0
0.1
0.1
0.0
1.1
0.1
0.2
2002
0.2
0.0
0.1
0.1
0.0
1.1
0.1
0.2
2003
0.2
0.0
0.0
0.1
0.0
1.1
0.1
0.2
2004
0.2
0.0
0.0
0.1
0.0
1.1
0.1
0.2
Source: Compiled by the UNCTAD secretariat on the basis of data supplied by reporting countries and other specialized sources. a Includes international cargoes loaded at ports of the Great Lakes and St. Lawrence system for unloading at ports of the same system. b See annex I for the composition of these groups, and note d thereto regarding the recording of trade of landlocked countries. Since 1986, Yugoslavia, previously included among the "developed market-economy countries", has been included in the group of "developing countries in Europe". c Includes lique.ed natural gas (LNG), lique.ed petroleum gas (LPG), naphtha, gasoline, jet fuel, kerosene, light oil, heavy fuel oil and others. d Includes the former Soviet Union in data for 1970 and 1980. e Estimates.
World seaborne trade in ton-miles, selected years (billions of ton-miles)
Year
Oil
Iron ore
Coal
Grain a
Five main dry bulks
Other dry cargoes
World total
Crude
Products
Crude plus products
1970
5597
890
6487
1093
481
475
2049
2118
10654
1975
8882
845
9727
1471
621
734
2826
2810
15363
1980
8385
1020
9405
1613
952
1087
3652
3720
16777
1985
4007
1150
5157
1675
1479
1004
4480
3428
13065
1990
6261
1560
7821
1978
1849
1073
5259
4041
17121
2000
8180
2085
10265
2545
2509
1244
6638
6790
23693
2001
8074
2105
10179
2575
2552
1322
6782
6930
23891
2002
7848
2050
9898
2731
2549
1241
6879
7395
24172
2003
8390
2190
10580
3025
2810
1273
7454
7810
25844
2004
8910
2325
11235
3415
2965
1325
8065
8335
27635
Source: Fearnleys, Review 2004. b Includes wheat, maize, barley, oats, rye, sorghum and soya beans.
World feet size by principal types of vessel, 2003-2005 a (beginning-of-year figures, in thousands of dwt)
Principal types
2003
2004
2005
Percentage change 2004/2005
Oil tankers
304396
316759
336156
6.1
36.1
37.0
37.5
Bulk carriers
300131
307661
320584
4.2
35.6
35.9
35.8
Ore/bulk/oil
12612
12110
9695
-19.9
1.5
1.4
1.1
Ore/bulk
287519
295551
310889
5.2
34.1
34.5
34.7
General cargo ships
97185
94768
92048
-2.9
11.5
11.1
10.3
Container ships
82793
90462
98064
8.4
9.8
10.6
10.9
Other types of ships
59730
47324
48991
3.5
7.1
5.5
5.5
Lique.ed gas carriers
19469
20947
22546
7.6
2.3
2.4
2.5
Chemical tankers
8027
8004
8290
3.6
1.0
0.9
0.9
Miscellaneous tankers
906
947
1001
5.7
0.1
0.1
0.1
Ferries and passenger ships
5495
5561
5589
0.5
0.7
0.6
0.6
Other
25833
11865
11565
-2.5
3.1
1.4
1.3
World total
844235
856974
895843
4.5
100.0
100.0
100.0
Source: Compiled by the UNCTAD secretariat on the basis of data supplied by Lloyd's Register - Fairplay. a Percentage shares are shown in italics.
- Via Raffaele Paolucci 17r/19r - 16129 Genova - ITALIA
tel.: 010.2462122, fax: 010.2516768, e-mail
Partita iva: 03532950106
Registrazione Stampa 33/96 Tribunale di Genova
Direttore responsabile Bruno Bellio Vietata la riproduzione, anche parziale, senza l'esplicito consenso dell'editore