| | |
| 13 giugno 2026 - Anno XXX |
|
|
| Quotidiano indipendente di economia e politica dei trasporti |
|
| | |
|
|
FORUM
|
dello Shipping
e della Logistica
|
|
|
|
|
|
|
|
CANTIERI NAVALI
|
|
|
|
Amburgo/Monfalcone
|
|
|
| |
|
| | | | | | | | | | | | | | |
|
|
TRASPORTO MARITTIMO
|
|
|
|
Nanchino
|
|
|
| |
|
| | | | |
|
|
TRASPORTO MARITTIMO
|
|
|
|
Atene
|
|
|
| |
|
| |
|
| PROSSIME PARTENZE |
|
|
|

|
|

|
|
|
|
|
| | | | | | | | |
|
|
PORTI
|
|
|
|
San Paolo/Abu Dhabi
|
|
|
| |
|
| | | | |
|
|
TRASPORTO MARITTIMO
|
|
|
|
Vado Ligure
|
|
|
| |
|
| | | | | |
|
TRASPORTO FERROVIARIO
|
|
|
|
Verona
|
|
|
|
|
| |
| | | | | |
|
CROCIERE
|
|
|
|
Ancona/Los Angeles
|
|
|
|
|
| |
| | | |
|
TRASPORTO MARITTIMO
|
|
|
|
Tallinn
|
|
|
|
|
| |
| | |
|
|
TRASPORTO MARITTIMO
|
|
|
|
Atene
|
|
|
| |
|
| | | |
|
FINANZIAMENTI
|
|
|
|
Milano/Napoli
|
|
|
|
|
|
|
|
CANTIERI NAVALI
|
|
|
|
Al Muharraq/Alang
|
|
|
| |
|
| |
|
SERVIZI MARITTIMI
|
|
|
|
Santiago
|
|
|
|
|
|
|
|
PORTI
|
|
|
|
Long Beach/Singapore/Hong Kong
|
|
|
| |
|
| |
|
TRASPORTO FERROVIARIO
|
|
|
|
Roma
|
|
|
|
|
| |
| |
|
PORTI
|
|
|
|
Barcellona/Algeciras
|
|
|
|
|
| |
| | |
|
|
TRASPORTO MARITTIMO
|
|
|
|
Hoofddorp
|
|
|
| |
|
| | | |
|
TRASPORTO MARITTIMO
|
|
|
|
Madrid
|
|
|
|
|
| |
| | |
|
|
PORTI
|
|
|
|
Brazzaville/Abu Dhabi
|
|
|
| |
|
| |
|
TRASPORTO MARITTIMO
|
|
|
|
Taipei
|
|
|
|
|
|
|
|
TRASPORTO MARITTIMO
|
|
|
|
Busan
|
|
|
| |
|
| | | | | |
|
|
TRASPORTO FERROVIARIO
|
|
|
|
Monaco
|
|
|
| |
|
| | | | | | | |
|
TRASPORTO MARITTIMO
|
|
|
|
Atene
|
|
|
|
|
|
|
|
PORTI
|
|
|
|
Los Angeles/Port Newark
|
|
|
| |
|
| | | | | | | | |
|
|
FORUM
|
dello Shipping
e della Logistica
|
|
|
|
|
|
ASSITERMINAL
|
|
|
|
Roma, 19 giugno 2025
|
|
| |
| |
|
TRASPORTO MARITTIMO
|
|
|
|
Ginevra
|
|
|
|
|
| |
| |
|
TRASPORTO INTERMODALE
|
|
|
|
Bologna
|
|
|
|
|
|
|
|
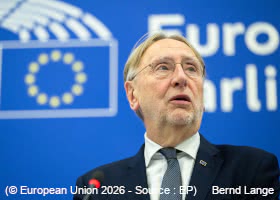
TRASPORTO MARITTIMO
|
|
|
|
Bruxelles
|
|
|
| |
|
| |
|
TRASPORTO MARITTIMO
|
|
|
|
Lussemburgo
|
|
|
|
|
| |
| | | | | |
|
|
CANTIERI NAVALI
|
|
|
|
Dakar/Gorinchem
|
|
|
| |
|
| | |
|
|
CANTIERI NAVALI
|
|
|
|
La Spezia
|
|
|
| |
|
| |
|
TRASPORTO MARITTIMO
|
|
|
|
Helsinki
|
|
|
|
|
| |
| | |
|
|
TRASPORTO MARITTIMO
|
|
|
|
Copenaghen
|
|
|
| |
|
| | | | |
|
|
TRASPORTO MARITTIMO
|
|
|
|
Monaco
|
|
|
| |
|
| |
|
|
|
|
 - Via Raffaele Paolucci 17r/19r - 16129 Genova - ITALIA
tel.: 010.2462122, fax: 010.2516768, e-mail
Partita iva: 03532950106
Registrazione Stampa 33/96 Tribunale di Genova
Direttore responsabile Bruno Bellio
Vietata la riproduzione, anche parziale, senza l'esplicito consenso dell'editore
|
|
|
|
|