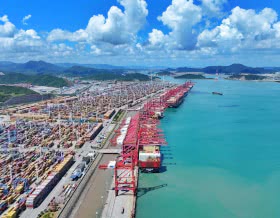
Lo scorso anno il porto di Keelung ha movimentato 88,3 milioni di tonnellate di merci, con un incremento del 15,4% rispetto al 1999. Lo scorso anno il porto di Keelung ha movimentato 88,3 milioni di tonnellate di merci, con un incremento del 15,4% rispetto al 1999.
Il traffico containerizzato, che rappresenta la gran parte dei carichi movimentati dallo scalo taiwanese, è stato pari a 1.954.573 teu, con una crescita del 17,3% sull'anno precedente. A parte una piccola quota di trasbordi, il traffico container è equamente suddiviso tra importazioni ed esportazioni. |
Port of Keelung
Traffic Statistics
(Source: Keelung Harbor Bureau)
| Incoming Vessels
| Throughput
| Tonnage Handled
| No. of Container Handled
|
| V.
| G.R.T.
| [M.t.]
| [M.t.]
| [TEU]
|
| 1976
| 4,766
| 30,351,837
| 7,701,640
| 20,372,255
| 338,883.50
|
| 1977
| 4,959
| 35,002,080
| 8,073,061
| 22,029,120
| 393,765.50
|
| 1978
| 5,223
| 37,454,475
| 8,881,426
| 24,924,902
| 473,669.00
|
| 1979
| 5,422
| 40,524,484
| 9,082,981
| 28,389,893
| 560,378.00
|
| 1980
| 5,536
| 43,650,224
| 10,298,353
| 35,185,553
| 659,644.50
|
| 1981
| 5,622
| 46,697,890
| 9,027,792
| 33,616,360
| 655,441.00
|
| 1982
| 5,763
| 50,292,979
| 8,283,007
| 33,281,635
| 702,921.75
|
| 1983
| 5,919
| 54,211,776
| 11,823,482
| 41,941,377
| 942,525.75
|
| 1984
| 6,237
| 62,403,372
| 14,213,408
| 53,487,360
| 1,233,794.00
|
| 1985
| 6,184
| 64,798,405
| 12,492,987
| 49,935,452
| 1,157,839.50
|
| 1986
| 6,648
| 75,657,688
| 16,417,277
| 66,173,400
| 1,587,328.25
|
| 1987
| 6,977
| 87,098,578
| 19,511,564
| 79,851,071
| 1,939,853.50
|
| 1988
| 7,243
| 92,915,606
| 21,979,341
| 76,592,926
| 1,761,695.00
|
| 1989
| 7,572
| 96,366,807
| 24,164,857
| 78,296,467
| 1,771,930.50
|
| 1990
| 7,623
| 97,928,414
| 25,190,289
| 79,614,832
| 1,840,794.00
|
| 1991
| 7,514
| 98,959,275
| 26,993,197
| 86,970,549
| 2,007,752.25
|
| 1992
| 7,908
| 107,424,625
| 26,146,190
| 85,267,124
| 1,940,587.25
|
| 1993
| 8,005
| 104,373,408
| 29,177,653
| 86,396,064
| 1,886,425.75
|
| 1994
| 8,026
| 109,224,152
| 29,586,162
| 91,626,299
| 2,046,588.50
|
| 1995
| 8,159
| 111,402,269
| 29,917,069
| 94,441,821
| 2,165,192.75
|
| 1996
| 8,431
| 116,557,500
| 26,300,924
| 89,407,242
| 2,108,578.50
|
| 1997
| 8,495
| 118,922,838
| 26,291,996
| 85,406,134
| 1,981,175.25
|
| 1998
| 8,609
| 111,985,171
| 23,958,060
| 76,148,902
| 1,706,873.25
|
| 1999
| 8,615
| 113,842,866
| 24,473,322
| 76,542,276
| 1,665,618.50
|
| December
| 699
| 9,332,208
| 2,150,166
| 6,796,881
| 149,503.25
|
2000
Accumulative total
| 9,165
| 121,045,686
| 24,975,629
| 88,336,130
| 1,954,573.50
|
| January
| 720
| 9,703,270
| 2,138,028
| 6,679,998
| 144,000.75
|
| February
| 592
| 8,327,073
| 1,411,738
| 5,591,928
| 126,282.00
|
| March
| 764
| 10,336,867
| 2,163,844
| 7,567,098
| 169,530.50
|
| April
| 795
| 10,486,867
| 2,196,306
| 7,730,827
| 167,196.00
|
| May
| 809
| 10,474,443
| 2,330,984
| 8,038,040
| 176,467.00
|
| June
| 787
| 10,515,853
| 2,283,209
| 7,704,582
| 174,228.00
|
| July
| 798
| 10,568,042
| 2,251,820
| 7,757,520
| 170,720.25
|
| August
| 807
| 10,454,109
| 2,038,919
| 7,473,962
| 165,936.25
|
| September
| 823
| 10,574,325
| 2,078,055
| 7,333,693
| 162,139.50
|
| October
| 788
| 10,164,483
| 2,213,899
| 7,817,761
| 172,849.75
|
| November
| 697
| 9,105,948
| 1,759,580
| 6,984,894
| 160,099.50
|
| December
| 785
| 10,334,406
| 2,109,247
| 7,655,827
| 165,124.00
|
Compared with
previous month
| Number
| 88
| 1,228,458
| 349,667
| 670,933
| 5,024.50
|
| %
| 12.63
| 13.49
| 19.87
| 9.61
| 3.14
|
Compared with
the same month
of previous year
| Number
| 86
| 1,002,198
| -40,919
| 858,946
| 15,620.75
|
| %
| 12.30
| 10.47
| -1.90
| 12.64
| 10.45
|
Cumulatived no.
Compared with
the same period
of previous year
| Number
| 550
| 7,202,820
| 502,307
| 11,793,854
| 288,955.00
|
| %
| 6.38
| 6.33
| 2.05
| 15.41
| 17.35
|
|