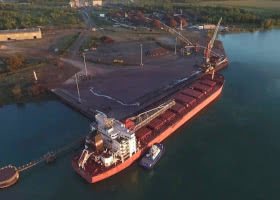
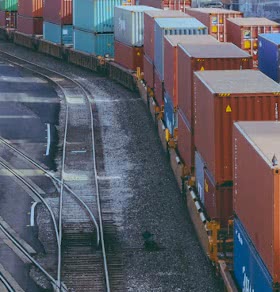
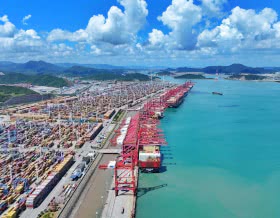
I dati preliminari del traffico container realizzato nel 2004 nel porto di Hong Kong - resi noti oggi dall'Hong Kong Port Development Council - mostrano un totale pari a 21.932.000 teu, con un incremento del 7,3% rispetto al 2003. Anche nel 2004 Hong Kong si è confermato al vertice della graduatoria mondiale dei porti container (inforMARE del 3 gennaio 2005). I dati preliminari del traffico container realizzato nel 2004 nel porto di Hong Kong - resi noti oggi dall'Hong Kong Port Development Council - mostrano un totale pari a 21.932.000 teu, con un incremento del 7,3% rispetto al 2003. Anche nel 2004 Hong Kong si è confermato al vertice della graduatoria mondiale dei porti container (inforMARE del 3 gennaio 2005).
Container Throughput of Hong Kong Port
(Source: Hong Kong Port Development Council)
Year/
month |
Kwai
Chung
Container
Terminals |
Other
than
Kwai
Chung
Container
Terminals |
Total |
Kwai
Chung
Container
Terminals |
Other
than
Kwai
Chung
Container
Terminals |
Total |
| |
'000 TEUs |
Year-on-year growth rate % |
| |
|
|
|
|
|
|
2001 |
11,285 |
6,541 |
17,826 |
-2.7 |
0.7 |
-1.5 |
2002 |
11,892 |
7,252 |
19,144 |
5.4 |
10.9 |
7.4 |
2003 |
12,070 |
8,379 |
20,449 |
1.5 |
15.5 |
6.8 |
| |
|
|
|
|
|
|
2004 |
|
|
|
|
|
|
Jan |
1,002 |
721 |
1,723 |
-3.2 |
7.1 |
0.8 |
Feb |
839 |
701 |
1,541 |
6.9 |
47.4 |
22.2 |
Mar |
1,045 |
893 |
1,939 |
1.7 |
28.4 |
12.5 |
Apr |
1,043 |
701 |
1,744 |
1.5 |
-5.5 |
-1.4 |
May |
1,131 |
702 |
1,833 |
14.5 |
4.3 |
10.4 |
Jun |
1,096 |
730 |
1,826 |
14.1 |
4.4 |
10.0 |
Jul |
1,192 |
671 |
1,863 |
17.1 |
0.4 |
10.5 |
Aug |
1,285 |
713 |
1,998 |
21.1 |
-2.3 |
11.6 |
Sep |
1,229 |
694 |
1,923 |
12.3 |
-3.5 |
6.0 |
'Oct |
1,250 |
689 |
1,938 |
21.9 |
-8.0 |
9.3 |
'Nov |
1,161 |
651 |
1,812 |
15.4 |
-13.0 |
3.3 |
'Dec |
1,152 |
641 |
1,793 |
10.8 |
-20.6 |
-2.9 |
| |
|
|
|
|
|
|
Cumulative |
|
|
|
|
|
|
2004 |
|
|
|
|
|
|
Jan |
1,002 |
721 |
1,723 |
-3.2 |
7.1 |
0.8 |
Feb |
1,842 |
1,422 |
3,264 |
1.1 |
23.8 |
9.9 |
Mar |
2,887 |
2,315 |
5,202 |
1.3 |
25.5 |
10.8 |
Apr |
3,930 |
3,016 |
6,946 |
1.4 |
16.6 |
7.5 |
May |
5,061 |
3,719 |
8,779 |
4.0 |
14.1 |
8.1 |
Jun |
6,156 |
4,449 |
10,605 |
5.7 |
12.4 |
8.4 |
Jul |
7,348 |
5,120 |
12,468 |
7.4 |
10.7 |
8.7 |
Aug |
8,633 |
5,832 |
14,466 |
9.2 |
8.9 |
9.1 |
Sep |
9,862 |
6,526 |
16,389 |
9.6 |
7.4 |
8.7 |
'Oct |
11,112 |
7,215 |
18,327 |
10.9 |
5.7 |
8.8 |
'Nov |
12,273 |
7,866 |
20,139 |
11.3 |
3.9 |
8.3 |
'Dec |
13,425 |
8,507 |
21,932 |
11.2 |
1.5 |
7.3 |
*Note :
The figures shown in black are released by the Marine Department and the Census and Statistics Department. The figures shown in blue italic are estimated by the Hong Kong Port Development Council (PDC) Secretariat based on the data provided by major operators.
|
|
|