1: Key Figures of the Danish Merchant Fleet, October 2001
| Size of the Danish Merchant Fleet |
| | Share of the World Merchant Fleet Selected
| |
| October 1, 2001 | |
| Types of Ships as per January 1, 2001
| Per cent |
| Number of Ships | 550 |
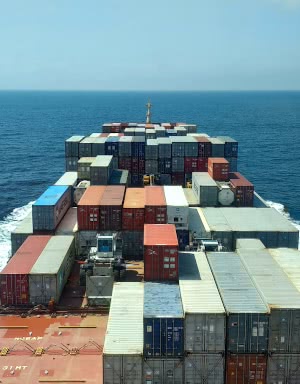
| Container vessels | 5.3 |
| TDW (million) | 8.1 |
| Chemical Tankers | 2.3 |
| GT (million) | 6.6 |
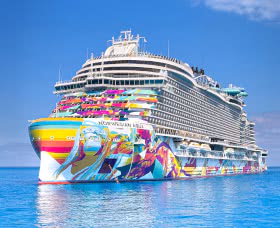
| Passenger ships, Ferries | 1.9
|
| | | | Reefers
| 1.5 |
| | | | LPG tankers
| 1.2 |
| | | | Total
| 1.2 |
| | | |
| |
Employment of The Danish Merchant Fleet
(Per cent based on GT) October 1, 2000
| | | Average Age of the Merchant Fleet,
January 1, 2001
| |
| Liner Trade | 66.3 |
| Denmark's Merchant Fleet (Year) | 6.8
|
| Tramp | 8.3 |
| World's Merchant Fleet (Year) | 13.7
|
| Tanker Trade | 25.4 |
| | |
| | | |
| |
Danish Shipping Companies' Newbuilding
Programme, October 1, 2001
| | | Danish Shipping Companies' currency Earnings
| |
| Number of ships | 64 |
| Currency Earnings 2000 (Billion DKK) | 85.9
|
| TDW (million) | 2.5 |
| Per cent of total Danish Currency Earnings
| 12.9 |
| GT (million) | 1.9 |
| Net Contribution 2000 (Billion DKK) | 17.2
|
| Total value (billion DKK) | 17.7
| | Estimated 2001 (Billion DKK)
| 100.0 |
| | | |
| |
Danish shipping Companies' most Important
Markets in 2000
| | | Number and Nationality of Employed on Danish
Ships as per September 1, 2000
| |
| The Markets' per cent of the gross freight |
| | Danish |
9,257 |
| Denmark | 2.4 |
| Scandinavian and EEC | 432 |
| Europe | 28.1 |
| Other Countries | 3,480 |
| Eastern Europe, Russia | 2.2
| | Total | 13,169
|
| Africa, South West Africa | 8.5
| | | |
| Middle East, India | 5.7 |
| Share of Danes employed on |
|
| Japan and Korea | 9.5 |
| Danish Ships (percent) | 70.3
|
| Other East Asian countries | 20.9
| | | |
| Australia and New Zealand | 1.8
| | | |
| USA, Canada | 15.5 |
| | |
| Latin America | 5.4 |
| | |
| Total | 100.0 |
| | |