2: Size and Composition of The Merchant Fleet
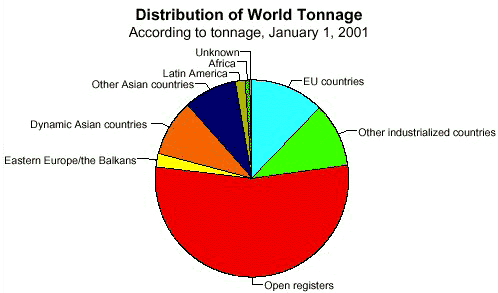
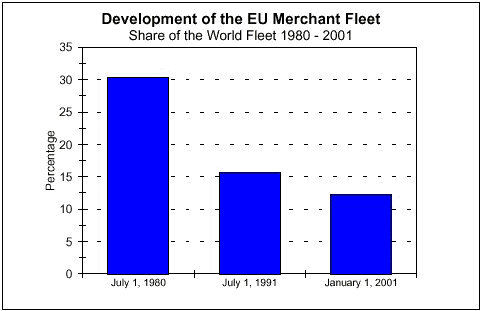
| Table 2.6: The Geographic Distribution of the World Tonnage (Merchant Ships)
|
| | July 1, 1980
| July 1, 1991 | January 1, 2001
|
| | GT | Pct.
| GT | Pct. |
GT | Pct. |
| | (1,000) | | (1,000) | | (1,000)
| |
| | | | | | | |
| EU countries | 127,437 | 30.35
| 68,275 | 15.66 | 65,141
| 12.32 |
| Other industrialized countries | 89,761
| 21.38 | 81,319 | 18.65
| 55,734 | 10.54 |
| Open registers | 109,309 |
26.03 | 153,514 | 35.21
| 285,551 | 54.00 |
| Eastern Europe/the Balkans | 34,457
| 8.21 | 38,765 | 8.89
| 11,665 | 2.21 |
| Dynamic Asian countries | 16,858
| 4.01 | 30,552 | 7.01
| 48,993 | 9.27 |
| Other Asian countries | 25,058
| 5.97 | 45,660 | 10.47
| 46,943 | 8.88 |
| Latin America | 12,146 | 2.89
| 12,737 | 2.92 | 8,740
| 1.65 |
| Africa | 4,885 | 1.16
| 5,204 | 1.19 | 4,023
| 0.76 |
| Unknown | 0 | 0.00
| 0 | 0.00 | 1,995
| 0.38 |
| Total | 419,911
| 100.00 | 436,026
| 100.00 | 528,785
| 100.00 |


|