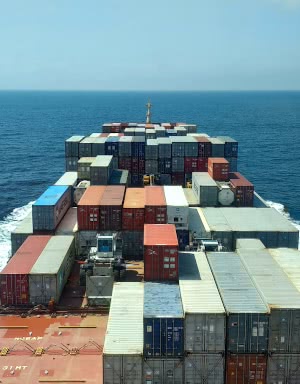
2: Size and Composition of The Merchant Fleet
| Table 2.10: Danish share of Various Types of Vessel
|
| | Danish flag
| World Total | Danish share
|
| Types of ships | Number
of ships
| GT
(1,000) | GT
(1,000)
| in percentage
(Tonnage) |
| | | | | |
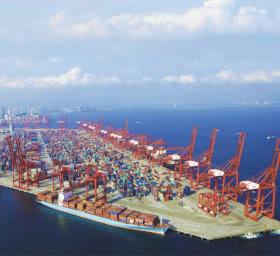
| Container | 67 | 3,168
| 60,201 | 5.26 |
| Chemical tankers | 38 | 419
| 18,065 | 2.32 |
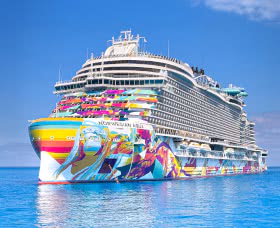
| Passenger ships/ferries | 88
| 420 | 22,479 | 1.87
|
| Reefers | 12 | 102
| 6,963 | 1.46 |
| LPG tankers | 30 | 240
| 19,656 | 1.22 |
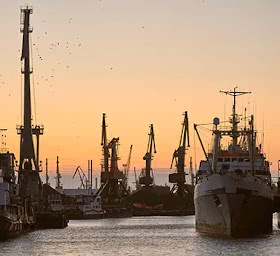
| General cargo | 225 | 398
| 55,607 | 0.72 |
| Ro-Ro | 14 | 218
| 27,126 | 0.80 |
| Oil- and Products tankers | 26
| 1,171 | 155,428 | 0.75
|
| Bulkcarriers etc. | 21 | 377
| 163,260 | 0.23 |
| Total | 521 | 6,513
| 528,785 | 1.23 |