|
|
| | | | |
|
| NÄCHSTE ABFAHRSTERMINE |
|
|
|

|
|

|
|
|
|
|
| MARITIME DIENSTLEISTUNGEN | | Savona | |
|
|
| | WERFTEN | | Hamburg/Monfalcone | |
|
|
|
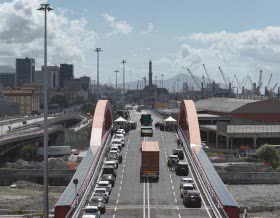
| | | | | | | | | | | | | | | SICHERHEIT & SCHUTZ | | Genua | |
|
|
|
| | | | | | | | | | | | | | | | | HÄFEN | | São Paulo/Abu Dhabi | |
|
|
|
| | | | | | | | | | | | | | | | KREUZFAHRTEN | | Ancona/Los Angeles | |
|
|
| |
| | | | | | | |
|
|
NACHRICHTENÜBERBLICK INHALTSVERZEICHNIS |
|
|
| | | | |
|
|
|
FORUM
|
über Shipping
und Logistik
|
|
|
|
|
|
ASSITERMINAL
|
|
|
|
Roma, 19 giugno 2025
|
|
| |
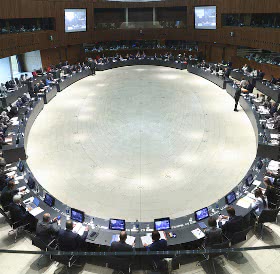
| | | | | | | | FINANZIERUNG | | Mailand/Neapel | |
|
|
| | WERFTEN | | Al Muharraq/Alang | |
|
|
|
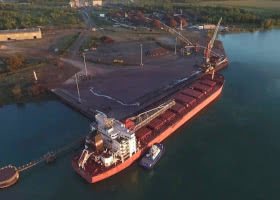
| | | MARITIME DIENSTLEISTUNGEN | | Santiago | |
|
|
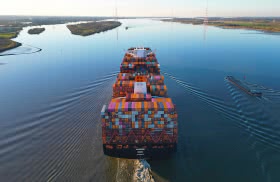
| | HÄFEN | | Long Beach/Singapur/Hongkong | |
|
|
|
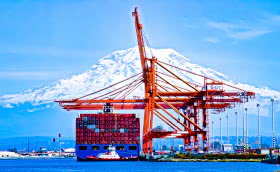
| | | | HÄFEN | | Barcelona/Algeciras | |
|
|
| |
| | | | | | | | | | HÄFEN | | Brazzaville/Abu Dhabi | |
|
|
|
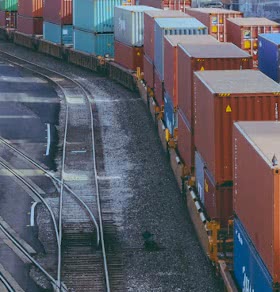
| | | | | | | | GÜTERVERKEHRZENTREN | | Nola/Mailand | |
|
|
| |
| | | | | | | | HÄFEN | | Los Angeles/Port Newark | |
|
|
|
| | | | | | INTERMODALEN VERKEHR | | Bologna | |
|
|
| |
| | | | | | | | UNTERNEHMEN | | Florenz/Valencia | |
|
|
| |
| | | |
|