|
|
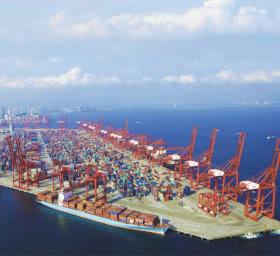
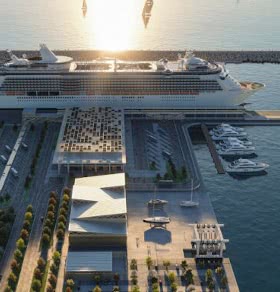
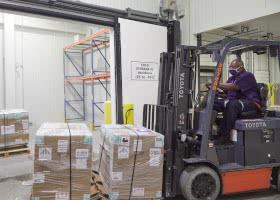
| | | | PLATEFORMES LOGISTIQUES | | Gênes | |
|
|
|
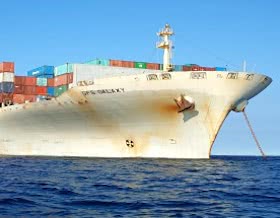
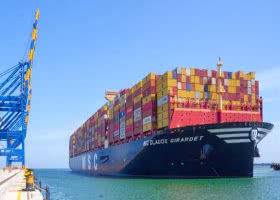
| | | | | | | | | | | TRANSPORT MARITIME | | Keelung | |
|
|
| |
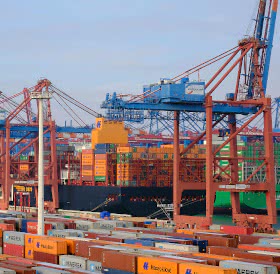
| | | | TRANSPORT INTERMODAL | | Rome |
|
|
| |
| | | |
|
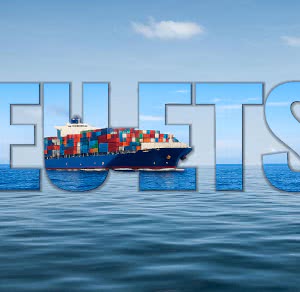
| LES DÉPARTS |
|
|
|

|
|

|
|
|
|
|
| | | | | | | | | | | TRANSPORT PAR CHEMIN DE FER | | Rome | |
|
|
| |
| | | | CHANTIERS NAVALS | | Monfalcone | |
|
|
|
| | | | | | TRANSPORT MARITIME | | Keelung/Taipei | |
|
|
| | TRANSPORT INTERMODAL | | Pescara |
|
|
|
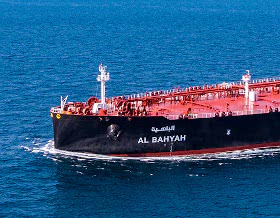
| | | | | | | SERVICES MARITIMES | | Gibraltar | |
|
|
|
| | | | | | TRANSPORT MARITIME | | Ancône/Zara | |
|
|
|
| | TRANSPORT MARITIME | | Hambourg | |
|
|
| |
| | | | | | TRANSPORT INTERMODAL | | Melzo | |
|
|
| |
| | | | | | | | TRANSPORT MARITIME | | Naples | |
|
|
|
| | | | | | |
|
|
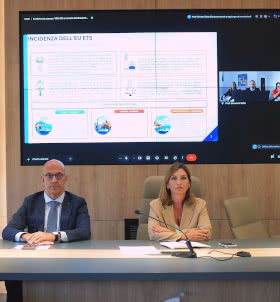
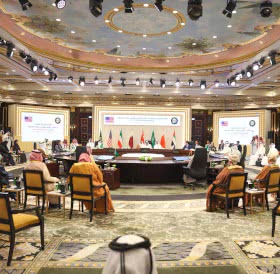
FORUM
|
des opérateurs maritimes
et de la logistique
|
|
|
|
|
|
ASSITERMINAL
|
|
|
|
Roma, 19 giugno 2025
|
|
| |
| | | | | | | | TRANSPORT MARITIME | | Copenhague | |
|
|
|
| | | | | | | | | TRANSPORT MARITIME | | Madrid | |
|
|
| |
| | | | | | PLATEFORMES LOGISTIQUES | | Padoue | |
|
|
|
| | | | | | | | | | | | | | | | | | TRANSPORT INTERMODAL | | Bruit | |
|
|
|
| |
|