The World Bank
MEASURING PORT PERFORMANCE
Patrick Fourgeaud
1 - PREAMBLE
This note proposes a more customized approach of indicators used
to monitor port performance, forecast development and set targets
in port sector projects. The main points are that, in most cases,
it is not possible to determine benchmarks which would be applicable
for any port, and that all expressions of port performance do
not address the same requirements. Therefore, carefully identifying
problems to be monitored and taking into account the main characteristics
of the commercial activity should lead to more accurate indicators
and targets.
Available data: In public ports, expressions of port performance
are based on data recorded by port authorities which traditionally
tend to focus on traffic recordings and parameters used in tariffing
of port services. Most available and reliable data are related
to the maritime interface where information is more easily collected
than on the land interface. Port Authorities usually monitor berth
occupancy and dwelling time of ships, characteristics of calls,
performance of ship-to-shore cargo handling and availability of
the main pieces of handling equipment. Additional but often less
reliable data may be available as regards landward operations:
dwelling time of cargo in ports' warehouses and storage areas,
characteristics of Customs and other administrative procedures
and, rarely, performance of handling for pick-up and delivery
of goods...
Most of the time, developing a relevant set of indicators would
require more information; a survey is the only way to identify
whether existing data are reliable, the cause and extent of existing
problems and the way they could be monitored.
Whatever criteria are chosen, they must be associated with a precise
definition of what is recorded, as all port authorities do not
take into account all parameters the same way; for example, they
may include empty containers, shifted and transshipped boxes
or the tare weight of unitized goods.
Forecast: These indicators are often used to forecast port
productivity and assess future capacity. Computerized simulation
systems can give accurate estimates of berth capacity and ships'
waiting time. Various statistical programs designed for all purpose
process modeling or specialized in transportation and port logistics
may be used. This note will remind of some simplifications of
the queuing theory, which can give rough estimates in some simple
cases.
Performance and competitiveness: These expressions of performance
display mainly a technical capacity. But shippers and ship-owners
have additional requirements; they are also looking for:
- reliability: a steady and predictable performance adapted to
shipping lines schedules;
- cost: a high performance at a competitive and predictable cost;
- quality: no overage, no wastage or pilferage or any damage
registered during handling and storage ope-rations. Progressively,
producers and transporters have to comply with international standards
(ISO 9000 or equivalent) and get their process certified; ports,
at least those operating in a competitive environment, have to
catch up with this trend;
- adaptability: a capacity to listen to their problems and needs,
negotiate and propose solutions.
A port is also a link in the transport chain and, of course, similar
requirements apply as regards capacity, performance and quality
of connections with short-sea and feeder shipping lines, and with
inland transportation networks : road, rail, barges.
Complying with these requirements results is competitiveness and,
ultimately, growing market share; ports process more traffic and
shippers benefit from lower freight rates and insurance premiums.
This can be assessed mainly indirectly. Fortunately, performance
and competitiveness are more or less linked: high productivity
is often synonymous with reliability and quality and, not systematically,
with low costs. Therefore, performance and cost targets are an
acceptable approximation of competitiveness.
1.2- technical valuation of port performance
Port operations are increasingly specialized and processed in
dedicated terminals but many flows of goods are still handled
at general purpose berths. Depending on the case, port performance
should be assessed for an homogenous set of berths or a terminal.
It is usually expressed as the average number of calls and the
average flow-volume or weight-of goods over a standard period
of time; number of calls per berth and per year, volume or weight
of cargo handled per hour, per call or per day, per gang or per
crane.
In addition, other criteria can be used to see how existing capacity
and performance meet the requirements of: i) the shipper or the
ship-owner: mainly average waiting time of ship, dwelling time
of cargo and data related to quality if possible, and: ii) of
the Port Authority: basically berth occupancy rate and global
traffic.
All these parameters are not equivalent:
- "snap-shot"performance (recorded during an hour, a
shift, a call) describes the technical capacity of a terminal;
a flow of goods recorded within a larger period depends also on
parameters related to competitiveness, market share, seasonal
effects, berthing capacity etc.
- Some of them are used to monitor specific points of concern
for port authorities, operators or clients and cannot improve
simultaneously. For example, Port Authorities are looking for
relatively high berth occupancy rates whereas shippers do not
accept significant waiting time.
1.3- explanatory factors
High performance is observed in private terminals and poorest
performance is often associated with ports run by public Port
Authorities, still in charge of cargo handling and maintenance
of equipment. Beyond such a statement, explaining a poor or a
good performance may require a more thorough analysis.
Exceptionally high performances occur when all parameters concur
positively: as far as containers are concerned, the typical high-performing
terminal is dedicated to one or a few shipping lines and privately
run, processes regular and well timed calls of large ships, with
economies of scale allowing it to be geared with the most high-performing
gantry cranes, and handles shipments representing the major part
of the ship capacity. Similar parameters can be mentioned in the
case of bulk (freighted) traffic.
Conversely, in poor performing ports, many causes, often interrelated,
may be mentioned,:
- Physical characteristics, mainly: nautical access: dredging
backlog and other factors narrowing the access time-slot; land
access: ill-maintained pavements, restricted access to land-transportation
networks; and port capacity: lack of berths and storage
areas, insufficient room for modern ship to shore operations;
- Organizational parameters, related to ships: old ships
with narrow hatches, large tween decks, slow moving derricks,
spending too long idle time at berth; cargo: ill packaged,
non unitized, damaged goods, organization of lashing-unlashing
of containers; handling capacity: unsuitable and ill-maintained
handling equipment, poorly trained work force, not enough crane
drivers, unsuitable, congested and poorly managed storage areas;
organization: non-productive methods, ill prepared calls,
too restricted working-time, unwillingness of port operators to
work at night, commercial operations interfering with ship-to-shore
operations, excessive dwelling time of cargo for commercial motives,
documentation delays; procedures: lengthy customs and other
administrative procedures and controls, corruption.
Public port authorities but also other administrations, port operators,
ship-owners, and shippers, involved in this process with their
own objectives, may be partly responsible for these shortcomings.
A rapid survey of the situation should help identify the main
causes of the problems and choose adapted criteria to monitor
further progress.
1.4- measuring port performances - basics
Poor performances are generally due to the organization of handling
and storage operations and of maintenance. Therefore, the most
common and practical way to measure port performance is to check
whether organization and yard equipment can match the actual capacity
of the main hoisting machines: generally quay cranes or gantries,
which are the most expensive and high-performing pieces of equipment.
The first step consists in determining the nominal and the optimum-or
commercial-output:
- The nominal output of a crane or a gantry is the theoretical
result when all parameters are optimized and reliability is absolute;
it can be precisely assessed by taking into account :
. the average load to be handled:
.. break-bulk and unitized traffic: unit load plus accessories:
spreaders... ;
.. dry bulk traffic : weight of buckets plus capacity x density
of product,
- the average duration of a whole handling cycle (loading or unloading),
taking into account the length and speed of each elementary move:
hoist, translation, rotation, lowering and back to hold, with
and without the load, according to the manufacturer's technical
specifications;
- The commercial output is lower; due to various factors:
. physical factors such as nautical and weather conditions impairing
average performance: tide, swell, wind or rain;
. factors related to port operations: average ships' characteristics,
time spent in stowage, trimming, for opening or closing of hatch-covers,
lashing-unlashing of containers, etc.
. equipment related factors: standard reliability of cranes,
the time it takes to shift them, to change buckets or spreaders,
and organization of work, i.e.: proportion of effective work-time
during a shift;
The second step is to identify the main causes of poor performance
and choosing adapted and measurable criteria.
Over a long period of time, additional delays must be deduced
from the commercial output to take into account the extra time
spent by ships when they are berthed, before and after commercial
operations, waiting for various motives: due to nautical and weather
constraints, because of locks or swaying bridges, waiting for
port services (bunkerage, repairs), because of non flexible working
time.
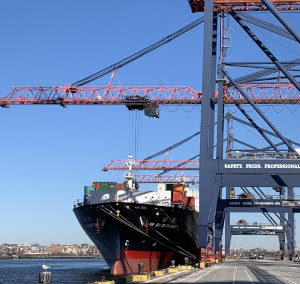
Benchmark: Most container gantry cranes have a theoretical output
of 35 to 40 moves per hour or more. The commercial output, depending
on local conditions, varies usually from 15 to 35 in average,
with peak performance nearing theoretical performance.
The Delta Sea-Land Terminal at Rotterdam has recently invested
in double-trolley gantry cranes and a fully integrated and automatized
system between ships and stacking areas which is intended to reach
50 TEUs per hour and per hold, i.e., almost doubling the usual
output.
In the case of continuous handling of bulk products, the commercial
performance may be closer to the theoretical output (80 to 90
%) with peak performance exceeding theoretical performance, depending
on the reliability of equipment and the characteristics and number
of products to be handled during a call.
|
As far as the performance of the land interface is concerned,
the problem is generally the lack of data;
- Average cargo dwelling time. A distinction should be drawn between
the impact of customs and other administrative procedures, of
shortcomings in storage management and cargo handling, and of
commercial practices (e.g., when port storage is less expensive
than private warehousing). The average dwelling time should not
exceed 5 days for containers, 7 to 10 days for general cargo,
two weeks for bulk products. Commercial constraints may lead to
longer delays.
- the average time spent by a trailer waiting for its load to
be located, handled, and to get its clearance, is usually known
only through occasional surveys, even though pick-up and delivery
of goods often accounts for a large part of the port congestion
and inefficiency. It should not exceed 4 to 6 hours. 2 hours are
the norm in modern container terminals.
Regarding equipment reliability, two parameters must be identified:
i) the reliability in operation, i.e., the number and length of
breakdowns occurring during commercial operations and: ii) the
average availa-bility, after deduction of planned maintenance
and all breakdowns.
For small pieces of equipment like tractors, trailers, forklifts,
availability should be very high (95 % or higher), provided that
their number matches the demand and standard preventive maintenance
is performed.
Regarding gantries, cranes, RTGs, breakdowns may occur and stop
port operations; with normal preventive maintenance, most of
them should be limited to electricity and automation problems
and repaired within a few hours. Availability should be more than
90 %. The norm in modern terminals is close to 98 %, or 2% unscheduled
downtime.
An occasional lack of gantry-cranes drivers may reduce the above
availability ; this parameter is not always identified.
2 - APPLICATION
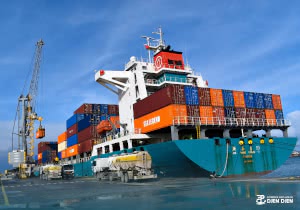
2.1 - containers
Container terminals performance depends on:
- ratio loaded vs. unloaded containers: empty boxes are not always
included in the port statistics (they may be considered as other
tare weights) but have to be handled;
- unproductive moves, i.e., the handling of all the containers
that do not have to be unloaded but have to be moved: mostly empty
and light containers and those containing hazardous materials,
loaded on top or on the deck;
- the level of automation of the gantry-cranes; one of the limiting
phases of the handling cycle is the time spent positioning accurately
the spreader on a container (loading), or the container on a trailer,
a MAFI trailer (specialized equipment used to shift containers
within port limits) or a chassis maneuvering on the apron (unloading).
Most modern gantries are automated and equipped with anti-sway
devices, and now, the problem is more the capacity to deliver
or remove containers without delaying ship-to-shore operations.
- the average weight of containers and the proportion of containers
requiring special attention: flats, liquid bulks, reefers etc.;
and the mix of containers of various sizes: 20'/40'/45' which
will require to maneuver or change spreaders;
- commercial constraints; most of the lines calling at a port
may have similar commercial constraints, leading to unevenly distributed
calls.
Highest performance is observed during calls of large container-carriers
loading and unloading a large number of containers, with balanced
flows of full containers in and out; terminals dedicated to a
single company can be highly productive (mainly East-West traffic);
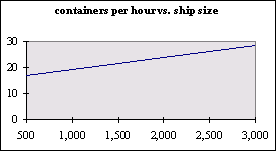
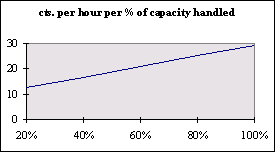
Various analytical approaches have been proposed; in 1998, Drewry
proposed linear functions of the vessel size and of the proportion
of the ship's capacity to be handled during one call.
(source: Drewry Shipping consultants: World Container Terminals
1997).
As far as costs are concerned, and since containerization is a
completely standardized process, it is widely accepted that there
is a single benchmark for all terminals operating a main flow
of containers in optimum conditions: about US$100 for all handling
and storage costs from ship to gate. Practically, real costs may
vary from US$ 80-90 in some terminals to more than US$ 400.
the case study below compares two different situations in order
to demonstrate how different parameters may affect performances.
Case no. 1: ship size: 3rd generation and larger,
length: about 300 m, calling for 1,000 containers or 1,500 TEUs,
average load per TEU:10 ton, proportion of 40-foot containers:
50 %, proportion of empty containers: 10 %, 2 to 3 gantries per
ship (3 gangs),
In that case, the capacity of the gantry cranes can be fully exploited:
the commercial output can be 25 to 30 move / hour / crane in average.
According to the above assumptions, performances can be expressed
as follows:
TEU f = TEU full
TEU e = TEU
empty
| ratios :
|
37.5 to 45 TEU f+e /hour/gantry,
|
34 to 40 TEU f /hour/gantry
|
|
94 to 135 TEU f+e /hour,
|
85 to 120 TEU f
/hour, 850 to 1,200 ton/hour,
|
|
2 to 3 shifts are required
| |
|
1 call / 2 days, 180 calls, 180,000 cts
|
2 calls / 3 days,
240 calls, 240,000 cts
|
|
240,000 TEU f /year1,
|
320,000 TEU f
/year
|
|
2,400,000 ton/year,
|
3,200,000 ton/year
|
|
8,000 ton/year per meter of berth
|
10,600 ton/year/meter of berth
|
This computation presupposes that several berths are available;
a one berth configuration would not be flexible enough and could
not perform efficiently; as soon as ships are moored, stevedoring
operations are supposed to start; they sail off at the end of
commercial operations without delay.
Ratios higher than 10,000 ton/year per meter of quay length may
be obtained: i) when large container carriers are fully loaded
or unloaded; ii) if traffic and port organization allow to raise
the berth occupancy rate without congestion; for example, with
6 calls per week, i.e., 300 calls per year, the ratio becomes:
13,250 ton/year/meter of berth.
Conversely, lower performances are recorded when smaller container-carriers
call for a limited number of containers and have to handle many
empty boxes (mainly North-South traffic);
case no. 2: ship size: 1st and 2nd
generation, length: less than 250 m, calling for 700 TEUs or
500 containers, average load per TEU: 13 ton, proportion of 40-foot
containers: 40 %, proportion of empty containers: 30 %, 1 to
2 cranes and 1 or 2 ship derricks (3 gangs) per call, 2 calls
every 3 days;
Performance: 20 to 25 move/hour with gantry-crane, 12 to 15 move/hour
with cranes or derricks,
With this new set of assumptions, the former expressions of performance
are modified as follows:
| ratios :
|
28 to 35 TEU f+e /hour/gantry,
|
17 to 21 TEU f+e /hour/ crane or derrick,
|
|
62 to 91 TEU f+e /hour,
|
|
20 to 25 TEU f /hour/gantry,
|
12 to 15 TEU f
/hour/ crane or derrick,
|
|
44 to 65 TEU f /hour/,
|
|
572 to 845 ton/hour,
|
|
2 shifts are required
|
|
120,000 TEU/year per berth, (1 cf previous case)
|
|
1,550,000 ton/year, 6,200 ton/year per meter of berth length.
|
This last result must be compared with 10,000 ton/m in case no.1;
both examples correspond to different but well operated terminals.
2.2- break-bulk :
Due to the wide range of products, ships, equipment, methods...,
assuming an average performance for all kinds of commodities and
packaging makes little sense:
- Specialized traffic like paper, frozen meat, fish or fruits
should be studied separately, according to their packaging and
to the type of ship and handling equipment (specialized or not);
see appendix one, the case of fruit handling.
- Most commodities in big bags, pre-slung or pre-palletized loads,
pallets, nets etc., can be handled with a crane; a good organization
should adapt to a rhythm of one cycle every 1.5 to 3 minutes (20
to 40 moves per hour), depending on the nature of the cargo, the
unit weight of the load, the ship's size and other factors as
weather conditions, tide and swell, etc. Whenever the volume of
goods to be handled is large enough to allow for a reasonable
cost recovery of additional equipment, special devices can be
adapted to improve the unit load or to shorten the cycle.
examples:
cements bags : 2 ton pallets built in the hold or on the
apron: 40 ton/hour/crane. Pre-palletized bags: 80 ton/hour/crane,
and more with spreaders. Cement in bulk can be handled at much
higher speed.
exotic wood: logs up to 6-8 tons, handled by the piece
with hydraulic clamps: 120 to 160 ton/hour/crane. Logs handled
with slings; less than 100 ton/hour; only in daylight.
2.3- dry bulk traffic
agri-food products / fertilizers :
These low-density products are transported in bulk-carriers ranging
from small cargo-boats (5,000 dwt) to cape-size bulk-carriers
used for basic products (100 to 130,000 dwt ships).
Handling of export products is operated mainly with conveyors,
whenever possible, with performances varying from 100 to nearly
1,000 ton/hour per conveyor, depending on ship size, port equipment,
product characteristics and density, brittleness, and environmental
and safety considerations linked to dust.
Ship to shore operations of import products require cranes and
hoppers (20 to 35 ton capacity - 150 to 300 ton/hour), or elevators
(400 to 1000 ton/hour) : two to three cranes per ship, or one
elevator and two or more cranes on panamax and larger ships;
On the apron, small cargoes are generally loaded in trailers;
large cargoes are carried through conveyor belts to warehouses
or silos. High performance may be reached only if ship to shore
operations are dissociated from commercial operations. Direct
delivery alongside is the major cause of poor performance in bulk
handling.
| ratios :
|
small bulk-carrier, 1500 to 3000 t shipment:
|
100/120 ton/hour per crane : 2 cranes
operated in one day
|
|
from panamax up to cape-size, 60,000 t shipment:
|
1 elevator and 2 cranes :
1,100 ton/hour, 15 to 18,000 ton/day
operated in four days
|
That performance may be reduced when operating multi-product cargo-ships.
Some sticky, dusty or hard-to-handle products, such as manioc
roots, impair the average performance. Brittle or dusty products
may require lower handling rate for quality, safety and environmental
purposes.
ore - coal : Export cargoes are usually loaded with conveyors;
1,000 to 2,000 ton/hour or more. Import traffic is handled with
large gantry cranes geared with very large grabs: up to 1,000
ton/hour/gantry crane or with special devices. Same constraints,
related to quality, safety and environment, may have to be taken
into consideration.
Bulk-carriers ranging from the panamax to the cape-size: throughput:
up to 15 to 20,000 ton/day
2.4- liquid bulk traffic
Generally, unloading performances depend on the size of the ship
which provides pumps and energy. They depend also on its viscosity,
temperature, and on safety regulations, for hazardous products.
Most liquid carriers are operated within one day, whatever the
size.
| throughput :
|
300 to 1,000 cu m /hour,
|
up to 10,000 cu m /hour and
more for very large tankers.
|
3 - THE LABOR ISSUE
The staffing issue is one of the most complex and its successful
settlement is often a key factor in a port restructuring process.
Some indications are summarized thereafter
3.1- principles
Globally, transportation systems are increasingly productive,
automatized and capital intensive. In all segments of the transport
chain, direct employment tends to be reduced and more qualified.
As far as ports are concerned, the situation where old public
organizations integrated many or all port-related functions, which
ended usually in a too large and poorly managed workforce, limited
or poor level of services and high operating costs, is changing.
Now, the private sector is increasingly associated in more efficient
and competitive port operations, mainly through concessioning
of infrastructures and privatization of services. The result
is reduced staffing at all levels, higher qualification requirements
and improved human resources management. Conversely, better performing
ports contribute to foster trade and develop national economies.
|
|
Whenever possible, first addressing the overstaffing issue will
facilitate the involvement of the private sector . Since this
situation is often the result of governmental policies considering
port organizations as natural shelters for an unemployed and unskilled
workforce, the same authorities have definitively a responsibility
in helping dismantle the system and make sure that the consequences
are properly cushioned. This supposes that adequate budgetary
means and staff management skills are made available early enough
in the process.
The concessioning process generally starts with industrial bulk
and container terminals, because these activities are easily standardized
and can be operated efficiently and with profit. Other fields
of the port activity have often more severe problems and excessive
staffing levels:
- The remaining port activities depend more on local conditions;
they are subject to variations, due to seasonal effects, meteorology,
variation in packaging and handling methods, low frequency of
some operations etc.;
- with less economies of scale, operators of non unitized general
cargo and miscellaneous bulks cannot easily invest in modern equipment
and methods and these activities are less often reorganized;
- the status of dock-workers placed under the responsibility of
public authorities and hired intermittently by stevedores, once
justified because of abusive practices, is still maintained in
some countries; but, this organization, created to protect an
undifferentiated low-skilled work-force in a context of weak labor
regulations cannot evolve and does not correspond any longer to
modern trends.
- In addition, some ports still maintain skilled workers and large
workshops in order to undertake most or all of maintenance work;
same thing as regards dredging;
- specific factors as social commitments of port authorities
(health centers, housing etc.), inappropriate monitoring and tariffing
procedures based on customs-like tax scales, are an additional
cause of excessive administrative staffing.
The overstaffing issue is not easily addressed. Worldwide experience
leads to recommend that the trade unions be brought to the negotiations
table from the outset, when the reform program starts being devised.
Actually, the most valid way to build confidence in the process
while incorporating in it lessons of experience and market-oriented
concerns is to bring together port users, port labor and port
and maritime employers. The objective is to allow all stakeholders
to share common concerns about competitiveness of port services,
and a better understanding of how any weakening of this competitiveness
would be detrimental to all, and in particular to the workforce
which would be the first to bear the consequences of reduced economic
activity, both inside and outside the port
3.2- proposed benchmarks
Port Authorities:
Some tentative benchmarks are proposed for Landlord Ports regulating
a diversified activity, managing a proportionate public and private
domain and not implied in commercial operations or services to
ships such as pilotage or towage.
|
Size of the Port Authority
|
|
recommended staffing level
|
|
small authority:
|
a few millions tons: about 50
|
|
average port authority:
|
10 to 20 M tons: from 150 to 200
|
|
large ports: example: R'dam:
|
300 M tons: 1,100
|
|
More generally, an indicative ratio would be:
|
100,000 ton per staff per year, with large variations:
- small ports require more than this proportion, large ports
are more productive;
- general cargo requires more staffing than bulk traffic.
|
Port operations
Containers: The recent study by Drewry, cited supra, as
well as other comparisons between efficiently run container terminals,
show a relatively constant productivity of about 1000 TEUs per
staff per year, for a large array of yearly throughput, from 150,000
up to 600,000 TEUs. This includes all staff: operational, administrative
and management.
Bulks: these operations require very few people: most automatized
processes include large gantries and belt conveyors, that require
only skilled drivers, a few supervisors and adapted crews for
instant maintenance in hydraulics, electricity and automation.
Additional staff are required occasionally, at the beginning,
for preparation, and at the end, for trimming of remaining cargo,
and for the cleaning of equipment.
Other operations (small bulks and general cargo):
In most cases, licensed port operators have a diversified activity:
handling of various commodities, shipping agency, freight forwarding,
inland storage etc., that helps them balance the level of employment.
Usually, they try to limit the level of unemployment, specially
when the old system of guaranteed salary for dock-workers has
been rescinded, but they cannot face peak periods. That may occasionally
lead to operate undermanned ships, hire temporary workers for
low skilled positions, differ storage operations etc.
An average productiveness can be computed only as regards cargo
handling (ship to shore), for a given commodity and handling technique.
Some examples below show the large variation in productiveness.
Examples:
|
1) boxes in 2-ton pallets built in the hold (fruits, frozen goods
etc.):
|
|
gang: total, 15 to 17 dockers, not incl.: transfer and storage
crew, crane driver, maintenance staff;
|
|
productiveness:
|
50 ton per hour
|
-» 3 ton /h / docker
|
| |
|
2) pre-palletized boxes, handled with cages:
|
|
gang: about 13, including transfer, not incl.: storage crew /
crane driver / maintenance staff;
|
|
productiveness:
|
225 ton per hour
|
-» 17 ton / h / docker
|
| |
| |
|
3) exotic wood in logs, handled with slings:
|
|
gang: 12 to 15 dockers, not incl.: transfer and storage crew /
crane driver / maintenance staff;
|
|
productiveness:
|
80 ton per hour
|
-» 6 ton / h / docker
|
| |
| |
|
4) exotic wood in logs, handled with hydraulic clamps:
|
|
gang: 10 dockers, not incl.: transfer and storage crew / crane
driver / maintenance staff;
|
|
productiveness:
|
140 ton per hour
|
-» 14 ton / h / docker
|
Economic approach
Some modern ports have computed the global workforce related to
the port activity, including handling operations, ship services
and administration of both authorities and private sector: these
figures relate to the port communities and are used in economic
studies.
Some examples:
|
Rotterdam (1997):
|
300 M tons
|
about 25,000 jobs
|
|
All (25) French Ports (1995):
|
275 M tons
|
about 35,000 jobs
|
4- NOTE ON BERTH OCCUPANCY RATE AND QUEUING THEORY:
Ships are berthed according to available space and other constraints
as number and size of bollards, number and location of main pieces
of handling equipment, nautical constraints etc. For example,
a 1000-meter quay can theoretically receive three large Panamax-type
ships or four or five smaller ones. Only simulation systems could
take these details into account. Analytical approaches require
that a number of berths be specified in advance. It must be done
by considering the length of ships commonly operated. Thus, if
a terminal actually accommodates ships with various sizes and
berthing space can be optimized, its real capacity may be slightly
underestimated when using the methods described below.
4.1- berth occupancy rate
This rate is usually computed over a year, to include seasonal
effects:
Cargo handling performance may be monitored by recording:
cumulated length of commercial operations alongside the quay
v/s...
...available time over the given period
The optimal use of infrastructure might be best monitored with
the following ratio:
cumulated length of call alongside the quay (including idle
time) v/s...
...available time over the given period (365 x 24 h)
The difference accounts for all tasks and procedures to be performed
when the ship is berthed, at the beginning or the end of the call.
It also includes the consequences of the organization of work:
restricted working time, lack of flexibility (shifts scheduled
at fixed hours) etc., and the consequences of other constraints
that apply to ships mooring or sailing out (tide, current, availability
of pilots and tugs, swing bridges, locks...).
A distinction must be made according to the way ships are chartered:
Liner-ships have to comply with a precise schedule. If
no berth is available at the time of arrival, the call may be
canceled, the cargo shifted to another port or waiting for the
next call. Thus, whenever competition exists between ports, the
berth occupancy rate usually does not exceed 50 to 60 %. Higher
rates can be seen when port facilities are saturated and there
is no alternative, or when it is possible to schedule precisely
a high number of calls; e.g., terminals dedicated to a single
intensive traffic like short-sea Ro/Ro traffic or some private
terminals operating on East-West trade with very intensive and
well coordinated activity.
chartered ships are usually less affected by port congestion,
depending on the nature of the cargo, the demurrage rate. Calls
may be planned only a few days or weeks in advance. Their length
may vary according to the nature and the size of the shipment.
High berth occupancy rates can be observed, up to 80 %, sometimes
more, generating significant waiting time.
Expanding the working period to 3 shifts per day and to the week-end,
whenever possible, is the first and simplest way of improving
this ratio.
4.2- queuing theories and simulations
Port congestion can be precisely assessed by using simulation
models taking into account each significant step of the process.
In some case, rough estimates can be obtained through simplifying
methods. A common one is based on the computation of the ratio:
waiting time/operating time, according to the berth occupancy
rate and the number of berths .
Theoretical requirements are: a set of identical berths where
an homogenous fleet of ships call on a first come first save basis.
Arrival patterns and distributions of service times are approximated
by a statistical law (Erlang distribution), simulating processes
ranging from the random distribution (Erlang 1) to increasingly
regular ones (Erlang 2, 3...).
The average assumptions for a freighted traffic are:
- no distinctive pattern of calls -» arrival at random,
- and various types of cargoes -» service time at random.
- or homogeneous traffic -» more regular service time, increasing
order of the Erlang law1,
The average assumptions for liner traffic are:
- strict compliance with a schedule, i.e., a fixed distribution
pattern of arrivals, -» (Erlang §), practically Erlang law at 2 to
4th order.
- variation of service time depending on the nature and size of
shipment. -» increasing order.
This method is more suitable for chartered traffic and should
not be applied to liner ships, as long as they do not wait.
In such a case , the max berth occupancy rate depends primarily
on the actual possibility to schedule calls evenly distributed.
This method represents correctly two phenomena:
- a very rapidly increasing waiting time when the berth occupancy
rate rises;
- a very rapidly decreasing waiting time when the number of berths
increases; dedicating an additional berth to an existing traffic
improves flexibility and capacity to a much larger extent than
the mere relative increase in the number of berths.
Generally, the maximum berth occupancy rate (corresponding to
a low average waiting time) is lower with liners than with freighters.
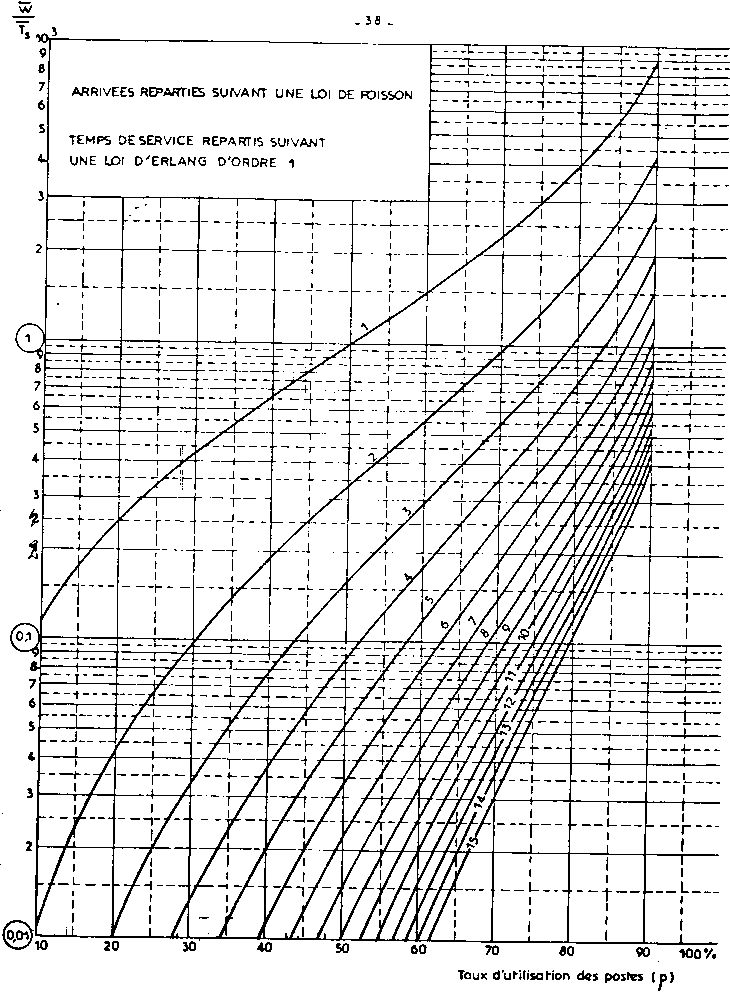
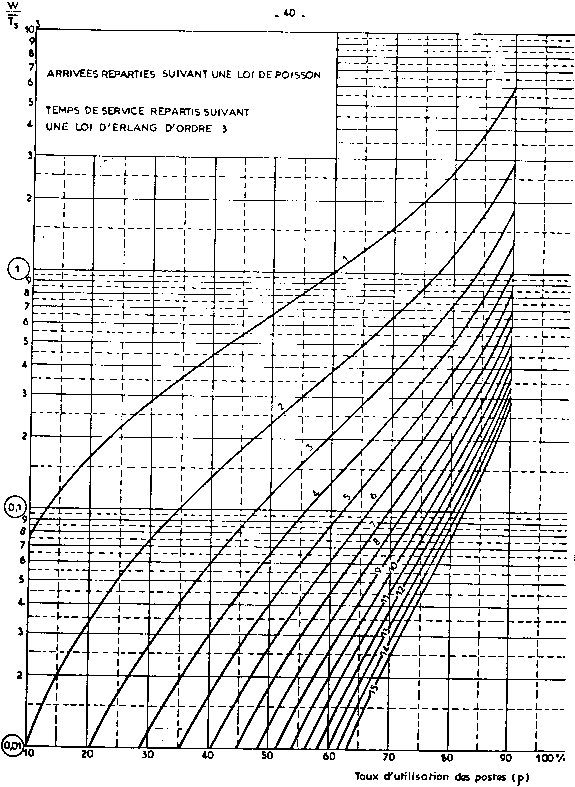
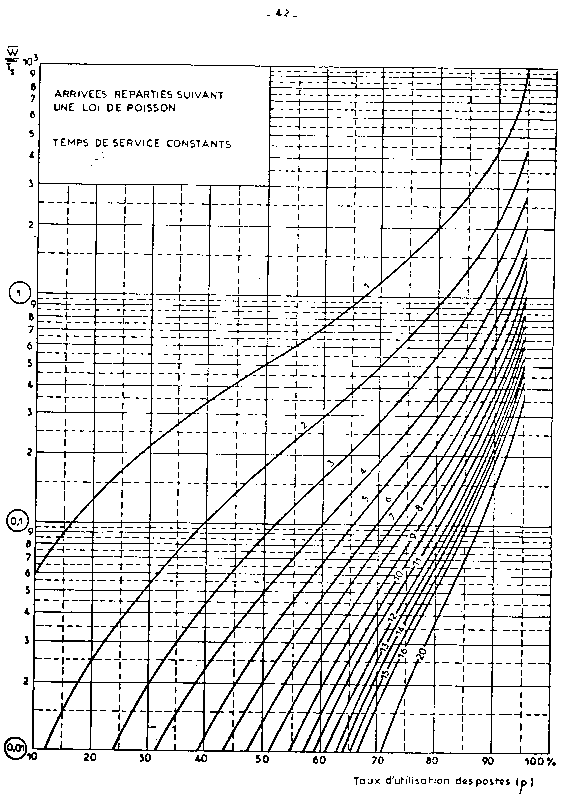
| nota: | The Erlang function is implicit. It has been tabulated
for some current cases or graphically translated. See in appendix
2 the table for E2/E2/N traffic (arrival and service time distributed
according to an Erlang 2 law) and some graphs corresponding to
usual combinations when arrivals are at random. The graphs give:
waiting time v/s service time, according to the berth occupancy
rate and the number of berths.
|
synthesis of the proposed approaches;
| mode | commodity | handling method | shipment's size | output per call | |
| unitized | containers | East-West traffic
Gantry cranes | 1,500 TEUs / call | 85 to 120 TEUs/hour | 11,000 ton/year/ meter of quay length |
| | containers | North-South traffic
gantries and derricks | 700 TEUs / call | 60 to 90 TEUs/h | 6,000 ton/year/ meter of quay length |
| break-bulk | cement:in/out | 2 ton pallets | variable | 120 to 240 ton/h | |
| | logs: unload. | hydraulic clamps | 3 to 5,000 ton | 300 to 400 ton/h | |
| | logs: unload: | slings | 3 to 5,000 ton | < 300 ton/h | daylight only |
| | fruits | box on pallets | variable | 42 to 55 ton/h | |
| | " " " | Pre-palletized | variable | 225 ton/h | |
| unitiz. | | containerized | variable | 700 ton/h | |
| dry bulk | animal feedst. | elevators | 30 to 60,000 ton | 1,100 ton/h | |
| | " " " " " " | cranes | 5,000 ton | 300 ton/h | |
| | ore/coal | cranes | variable large | 1,000 to 1,500 ton/h | |
| liquid bulk | crude oil | pumps | large (VLCC) | up to 15,000 ton/h | |
| | misc. | pumps | variable, small | 300 to 1,000 ton/h | |
| Berth occupancy rate | Liner shipping | 40 to 60 % | No delay; competitive traffic |
| | Freighted traffic | 60 %, up to 80 % | Significant delays |
| Port equipment availability | Tractor - trailers | 90 - 95 % | adapted fleet - adapted maintenance |
| | Gantries - cranes | 80 - 90 % | adapted maintenance |
|
Appendix n. 1: handling of boxes
Bananas, and other fruits, are packed in cardboard boxes, whose
size and weight differ according to the final destination (roughly:
0.40 x 0.50 m; variable height ; 13,5 to 19.5 kg).
Three ways of handling these boxes are listed below, according
to the resulting output:
|
i) boxes are handled in bulk; ships are loaded by building pallets
on the apron and dismantling them in the hold (the cargo can be
unloaded the same way). This is the traditional (and slow) way
of handling boxes and bags, requiring a large work-force. On the
other hand, the full capacity of reefers can be used (less broken
stowage in old ships).
|
In average, a good handling throughput is about:
|
15 to 20 pallet/hour
per hold,
|
|
i.e.:
|
720 to 960 box/hour,
|
|
or, with 19.5 kg boxes (48 boxes per pallet), about:
|
14 to 19
ton/hour;
|
|
on three holds, an expected throughput can be:
|
2,100 to 2,800 box/hour
|
|
or:
|
42 to 55 ton/hour.
|
|
With 20 working hours per day:
|
850 to 1,100 ton/day
|
|
or, with the same assumptions:
|
42 to 56,000 box/day
|
|
ii) pre-palletization is more and more widespread. Palletized
fruits may be handled with cages holding two to four pallets at
a time (when there is no more space in the hold to operate this
way, each loading level is ended with several pre-slung pallets);
cages are loaded/unloaded on the apron by one or two twin-fork
front loaders, holding 2 pallets at a time; they are handled in
the hold by four dock-workers using pallet-trucks. The average
output, strongly depending upon organization of space and of operations,
can be very high; at peak production, up to 150 pallet/hour per
hold,
|
in average:
|
80 / 100 pallet/hour per hold,
|
|
with 80 pallets/hour/hold in average:
|
3,800 box/hour per hold
|
|
or:
|
75 ton/hour per hold,
|
|
on three holds:
|
11,400 boxes/hour
|
|
or:
|
225 ton/hour,
|
|
with 20 working hours/day:
|
4,500 ton/day;
|
|
or:
|
230,000 box/day,
|
|
iii) containerization: this is the last step of unitization; it
is much more capital-intensive and not widespread. A 40' container
holds 20 pallets. The handling throughput can be:
|
|
15 cont./hour per crane,
|
|
or:
|
300 pallet/hour per crane,
|
|
or:
|
14,000 box/hour per crane
|
|
or:
|
280 ton/hour per crane
|
|
with 20 working hours/day: an average shipment can be loaded in
less than one day.
|
|
iv) a fourth method exists, where boxes are loaded and unloaded
in bulk. Special devices are used, based on conveyors: mobile
ones, assembled for each call, or mounted on gantries (ref: Antwerp).
Productivity vary between the first and second case and may be
higher, depending on the level of equipment.
|
Appendix no. 2: waiting time and berth occupancy rate: table
and graphs
Table E2/E2/N: CNUCED
Graphs: French Ministère de l'Equipement: Service Central
Technique des Ports Maritimes et des Voies Navigables
|
1): Arrival at random, service time at random
2): Arrival at random, service time Erlang 3
3): Arrival at random, service time: constant
4): Arrival and service time : Erlang 2
| Berth occupancy rate
|
No. of |
Berths
| Ratio: | Average
waiting time
| Vs. Average
service time
| | | |
| % | 1
| 2 | 3
| 4 | 5
| 6 | 7
| 8 |
| 10 | 0.02
| | | |
| | | |
| 15 | 0.03
| 0.01 | |
| | |
| |
| 20 | 0.06
| 0.01 | |
| | |
| |
| 25 | 0.09
| 0.02 | 0.01
| | | |
| |
| 30 | 0.13
| 0.02 | 0.01
| | | |
| |
| 35 | 0.17
| 0.03 | 0.02
| 0.01 | |
| | |
| 40 | 0.24
| 0.06 | 0.02
| 0.01 | |
| | |
| 45 | 0.30
| 0.09 | 0.04
| 0.02 | 0.01
| 0.01 | |
|
| 50 | 0.39
| 0.12 | 0.05
| 0.03 | 0.01
| 0.01 | 0.01
| |
| 55 | 0.49
| 0.16 | 0.07
| 0.04 | 0.02
| 0.02 | 0.02
| 0.01 |
| 60 | 0.63
| 0.22 | 0.11
| 0.06 | 0.04
| 0.03 | 0.02
| 0.01 |
| 65 | 0.80
| 0.30 | 0.16
| 0.09 | 0.06
| 0.05 | 0.03
| 0.02 |
| 70 | 1.04
| 0.41 | 0.23
| 0.14 | 0.10
| 0.07 | 0.05
| 0.04 |
| 75 | 1.38
| 0.58 | 0.32
| 0.21 | 0.14
| 0.11 | 0.08
| 0.07 |
| 80 | 1.87
| 0.83 | 0.46
| 0.33 | 0.23
| 0.19 | 0.14
| 0.12 |
| 85 | 2.80
| 1.30 | 0.75
| 0.55 | 0.39
| 0.34 | 0.26
| 0.22 |
| 90 | 4.36
| 2.00 | 1.20
| 0.92 | 0.65
| 0.57 | 0.44
| 0.40 |
|