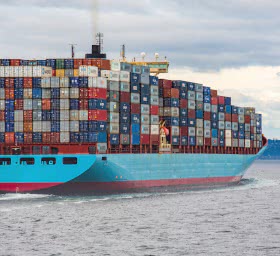
Nello scorso gennaio il traffico container tra Asia e Stati Uniti è cresciuto sensibilmente rispetto allo stesso mese del 2002. Nella relazione eastound - ha specificato oggi il Research Co-operation Office della compagnia di navigazione giapponese Mitsui O.S.K. Lines (MOL) - il trasportato è stato pari a 724.232 container da venti piedi, con un incremento del 28,1% rispetto al gennaio 2002 ed una flessione del 6,1% rispetto al dicembre 2002. Nella relazione westbound il traffico è ammontato a 294.762 teu, con una progressione del 20,4% rispetto al gennaio 2002 ed un calo del 3,9% rispetto al dicembre 2002.
Asia/US Montly Container Cargo Movements (in TEU) Nello scorso gennaio il traffico container tra Asia e Stati Uniti è cresciuto sensibilmente rispetto allo stesso mese del 2002. Nella relazione eastound - ha specificato oggi il Research Co-operation Office della compagnia di navigazione giapponese Mitsui O.S.K. Lines (MOL) - il trasportato è stato pari a 724.232 container da venti piedi, con un incremento del 28,1% rispetto al gennaio 2002 ed una flessione del 6,1% rispetto al dicembre 2002. Nella relazione westbound il traffico è ammontato a 294.762 teu, con una progressione del 20,4% rispetto al gennaio 2002 ed un calo del 3,9% rispetto al dicembre 2002.
Asia/US Montly Container Cargo Movements (in TEU)
| | E/B (from Asia to US) | W/B (from US to Asia) |
| | 2001 | 2002 | growth | 2003 | growth | 2001 | 2002 | growth | 2003 | growth |
| Jan | 573,028 | 565,230 | -1.4% | 724,232 | 28.1% | 265,044 | 244,908 | -7.6% | 294,762 | 20.4% |
| Feb | 458,957 | 601,374 | 31.0% | | | 264,869 | 272,793 | 3.0% | | |
| Mar | 563,223 | 570,084 | 1.2% | | | 297,893 | 301,367 | 1.2% | | |
| Apr | 570,459 | 707,206 | 24.0% | | | 267,157 | 299,105 | 12.0% | | |
| May | 562,857 | 709,877 | 26.1% | | | 270,977 | 308,597 | 13.9% | | |
| Jun | 595,710 | 763,896 | 28.2% | | | 256,036 | 280,487 | 9.5% | | |
| Jul | 616,628 | 759,299 | 23.1% | | | 249,203 | 255,162 | 2.4% | | |
| Aug | 681,049 | 846,817 | 24.3% | | | 258,949 | 281,777 | 8.8% | | |
| Sep | 686,051 | 809,195 | 17.90% | | | 244,457 | 240,437 | -1.60% | | |
| Oct | 684,081 | 740,067 | 8.20% | | | 284,047 | 222,936 | -21.50% | | |
| Nov | 565,290 | 696,218 | 23.20% | | | 278,580 | 297,987 | 7.00% | | |
| Dec | 559,040 | 770,887 | 37.9% | | | 262.100 | 306,638 | 17.0% | | |
| YTD | 573,028 | 565,230 | -1.4% | 724,232 | 28.1% | 265,044 | 244,908 | -7.6% | 294,762 | 20.4% |
| Jan/Mar | 1,595,208 | 1,736,688 | 8.90% | | | 827,806 | 819,067 | -1.10% | | |
| Apr/Jun | 1,729,026 | 2,180,979 | 26.10% | | | 794,171 | 888,189 | 11.80% | | |
| Jul/Sep | 1,983,729 | 2,415,312 | 21.80% | | | 752,609 | 777,376 | 3.30% | | |
| Oct/Dec | 1,808,411 | 2,207,172 | 22.1% | | | 824,727 | 827,564 | 0.3% | | |
| Jan/Dec | 7,116,374 | 8,540,151 | 20.0% | | | 3,199,313 | 3,312,196 | 3.5% | | |
(Source: Shipping Research / Mitsui O.S.K. Lines)
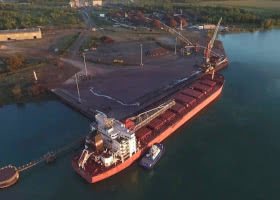
DEMOLITION ACTIVITY
(Source: MOL)
(Thousand Dwt)
| Year, Month
| Bulk
Carriers
| Tankers
|
| 2002
| 1 | 603
| 2,314 |
| | 2
| 516 | 3,155
|
| | 3
| 344 | 684
|
| | 4
| 310 | 1,749
|
| | 5
| 226 | 3,629
|
| | 6
| 566 | 405
|
| | 7
| 359 | 495
|
| | 8
| 737 | 1,202
|
| | 9
| 382 | 1,900
|
| | 10
| 416 | 985
|
| | 11
| 114 | 613
|
| | 12
| 118 | 1,368
|
| TOTAL
| 4,691 |
18,499 |
| 2003
| 1 | 147
| 839 |
| | 2
| | |
| | 3
| | |
| | 4
| | |
| | 5
| | |
| | 6
| | |
| | 7
| | |
| | 8
| | |
| | 9
| | |
| | 10
| | |
| | 11
| | |
| | 12
| | |
| TOTAL
| 147 | 839
|
Source: The Drewry Monthly
|
|