
The tanker market in 2001
|
The crude oil transport
|
|
|
| |
|
Our conclusions in the last annual report
ended on a relatively optimistic note. On the basis of forecasted economic
growth on one hand and the expected movement of deliveries and scrapping
within the fleet on the other hand, it was predicted that there should be
an effective balance between supply and demand up until the end of 2002.
It was logical that there should be a technical adjustment to freight
rates after the unreasonable (?) levels reached in 2000. Nonetheless the
general opinion was that they would remain favourable to owners for a
further 18 / 24 months.
As we shall see later on, this optimism was quickly beating a retreat.
The economic indices were turned upside down and the negative results that
followed were magnified by external factors both of a dramatic and
unexpected nature.
It is clear that in the current climate, optimism has taken a back seat
for 2002 and even 2003, which look like being difficult times for owners.
The massive orders of the last two years have not been matched by the
anticipated demand. The effect of the economic recession, even
short-lived, will cause a dramatic drop in the rate of new orders and
probably help to accelerate the number of vessels being scrapped.
As has been traditionally the case, the wild swings which are
characteristic of this market produce freight rates which seem incapable
of remaining stable either in the medium or long-term.
After a quick study of the macro-economic factors that have marked this
past year, we will look at the effects in each of the main size
categories.
We will attempt to show, beyond the justified short-term pessimism, the
reasons why we believe this will be a relatively brief period and that it
should not undermine our longer term view that we gave in our last report.
|
|
| Reasons
for the downturn |
|
After record growth rates in 2000, the
industrialised countries experienced a leaner year in which the indicators
quickly turned from rosy to gloomy. Forecasts for the main economic
indices were continually readjusted downwards throughout the year.
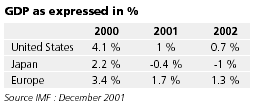
The American market which has been the leading participant and driving
force over the last two years in the highly active freight market got hit
badly. The first signs of an economic slowing down, then of a recession,
were visible well before September 11th with notably some alarming
unemployment figures. The wave of terrorist attacks on September 11th,
beside their despicable nature and the geopolitical consequences, only
served to brutally reinforce the sombre mood and even add a touch of
psychosis.
However, as already remarked by a number of commentators and taking
into account the American spirit, the current crisis, while an undeniable
fait accompli, should nonetheless be of a relatively short duration.
Outside the U.S., all industrialised countries have readjusted their
forecasts and lowered their growth rates, without citing Japan which is
still languishing in the doldrums'
However even if other countries do not foresee their growth as being so
severely affected, there can be little doubt that short-term prospects do
not augur for sufficient energy consumption in the current market to
offset the tonnage supply which has swung into surplus.
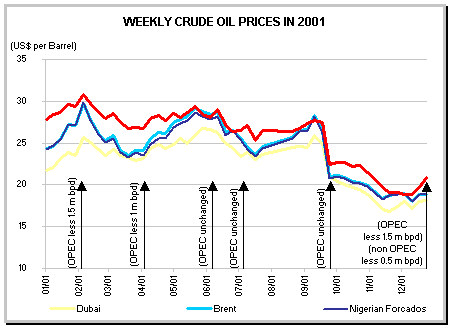
In view of this sudden drop in demand, oil prices have followed suit.
As can be seen in the following graph, the repeated efforts of the
producing countries to stimulate prices by turning off the taps have not
met with much success.
A few conclusions can be drawn from the following graph:
- After having frequently risen above $30 per barrel in 2000, crude
prices for the year will average out at near to $25 per barrel.
- The drastic measures taken by OPEC members to reduce production
quotas successively have had only a short-lived effect on crude
prices. The September 11th events plunged markets into a profound
apathy and prices quickly collapsed. Realising that a sudden further
reduction on production quotas would have little effect on prices, the
producing countries waited and now are placing their hopes on a new
reduction of 2 million barrels per day (1.5 million OPEC, and 0.5
million non-OPEC) as from January 2002. If this policy is respected by
all it should allow prices to consolidate around $20 per barrel.
However it is also clear that playing around with supply is not enough
so long as demand in the current economic climate has not picked up to
normal and regains a sustained growth rate.
Faced with such drops in production and therefore in demand for
transport, owners can no longer pretend to be able to maintain freight
rates for long. We shall see further on that certain categories are
suffering more than others.
|
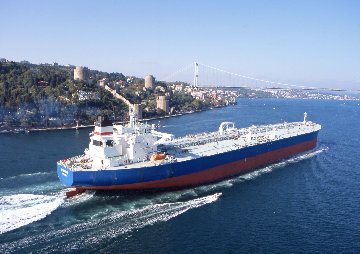 |
Besiktas
164,626 dwt, blt 2001 by Hyundai HI, owned by Besiktas Denizcilik |
|
| Effects
on the freight rates
|
|
|
|
It is without question this category which is the most exposed to the
tightening measures being imposed by the producers. Directly dependent
on liftings from the Middle East Gulf, the rates have very quickly taken
a dive.
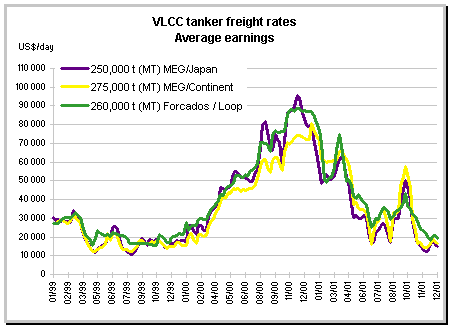
With the exception of three jolts of varying degrees, the fall in
rates has been sharp and painful. Taking all routes into account, in the
course of the year equivalent time charter rates have slumped from
$80,000 per day to $20,000 per day.
|
|
One can clearly see in the graph (and as evidenced elsewhere) that
the events of September 11th in the U.S. have had a substantial impact.
Proof of the underlining weakness of the current market in contrast
to the year 2000 is that voyages to the Far East (which are the most
active for this size of vessel) have triggered and helped accentuate for
the most part this drop in rates.
The Japanese and Korean oil companies' owned fleet have not been
employed 100%, and these 'relets' heavily weighed on further
depressing the market and largely explains the strong drop in rates on
these routes.
|
|
|
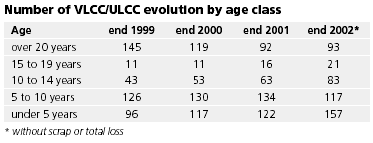
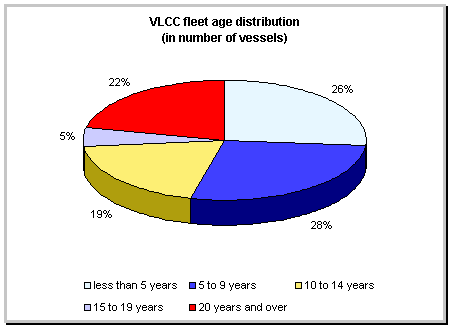
Without actually offsetting the loss of traffic on liftings out of
the Middle East Gulf, there has been again this year a very strong
increase in combined cargo movements from West Africa with Far Eastern
refineries as the main destination.
While such movements serve as a safety valve for VLCC owners in the
difficult times that they are now experiencing, this business as we will
see later on, is being done to the detriment of the traditional traffic
which belonged to the Suezmax size.
The new drop in crude oil production of 1.5 million barrels per day
decided by OPEC with effect from January is likely to keep an already
weak global market under pressure, compounded by a supply of tonnage
which is growing both quantitatively and qualitatively.
The orders for newbuildings which were made in euphoric mood
immediately after 1999 will start weighing heavily in the forthcoming
months. Only an increase in the number of scrapping of the oldest units
can give any hope to owners.
Two other factors which are not helping freight rates are:
- Tankers which are oil company operated are no longer guaranteed to
find full employment and will continue to depress the market.
- The policy of pooling which seemed last year to be a stimulating
factor for freight rates, is now causing various commercial
difficulties. In many cases we have already seen that the pool has
no option but to anticipate and even exaggerate a drop in freight
levels'
|
|
|
|
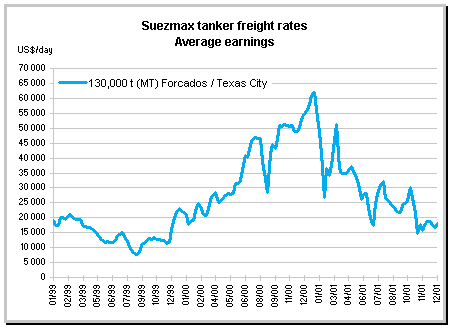
As with the VLCC, the turnaround in the tendency between 2000 and
2001 was sudden and resulted in a rapid deterioration in the general
state of the market.
Time charter equivalents that were frequently above $60,000 per day
at the start of the year slipped in some cases at the end of the year
below $20,000 per day. Nonetheless the greater flexibility which
characterises this category of tankers has allowed owners to stabilise
their minimum returns at proportionally better levels than the bigger
sizes. As comparison, average returns in 1999 were only $15,000 per day.
|
|
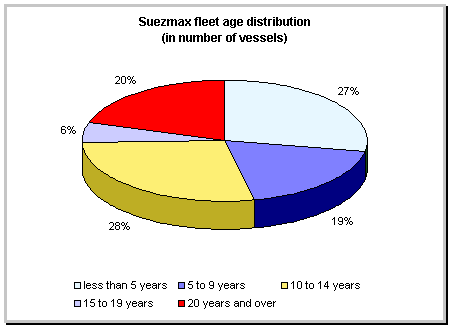
As already stated in our previous report, the West African market no
longer plays a predominant role as pacemaker. As mentioned above, VLCC
are responsible for this and two 1 million barrels lots are more and
more frequent not only in movements to the East but also towards the US
and Europe.
However activity for other destinations in this size category of ship
is regularly increasing and allows owners to ensure a much better
balance on employment.
The North Sea and the Caribbean markets remain relatively on the
sidelines. The Middle East Gulf tends to favour the older category of
ships.
The Mediterranean is experiencing a surge in activity. Liftings from
the 'Sumed' pipeline outlet are stable and risk staying that way due
to the competition of the low VLCC levels. In addition, Irak crude out
of the Ceyhan terminal, so long as the United Nations 'oil for food'
agreements continue, is favourable to the Suezmax size.
Liftings of Russian crude (or from CIS countries) out of the Black
Sea are in constant progression. Due to the technical constraints
imposed, modern vessels are required and these fixings serve as a
barometer of the market more and more. Analysing the graph which gives
returns on different voyages both in 2000 and in 2001, shows that the
Mediterranean zone often acts an accelerator in a rising market or a
brake in a falling one.
As with the VLCC, the policy of pooling put in place these last few
years helped stimulate the market in 2000. However in today's climate
of economic recession, it plays a prominent role in the weakening of
rates. It is a case of doing everything possible to prevent
non-employment of their fleet, which appears today to be in large
surplus.
|
|
|
|
|
Even more so than the Suezmax size, the great flexibility of the
Aframax category allows owners to limit the impact of the economic
crisis which we are currently experiencing.
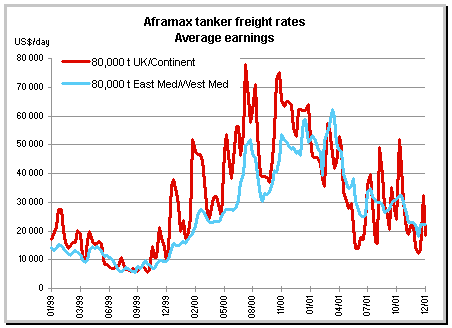
The analysis of the evolution of returns on the main routes shows
once again the strong downturn in levels after the peaks reached in 2000
|
|
One notices however that in general, the drop is less for this
category of vessel. Even if rates have plunged from $50,000 per day at
the beginning of the year to about $20,000 per day at year's end, the
floor level (for the moment) has proportionally less of an affect on
owners for this size compared to the larger sizes. As additional
evidence of this stronger resistance: at the end of 2001, a 12 month
time charter is negotiated at around $22,000 per day for a modern
Suezmax and still $20,000 per day for a modern Aframax.
The inter-North Sea activity continues to be marked by wild
fluctuations but with peak demand and rates for liftings recurring
end-month.
As a general rule, the Mediterranean has produced the best results
for owners with equivalent time charters above $30,000 per day on
average over the year. Despite a lessening in demand, charterers have to
be on their toes in this zone. Availability of quality ships remain
precarious and obliges the charterer to cover his needs two to three
weeks in advance with all the incumbent risks. The still important
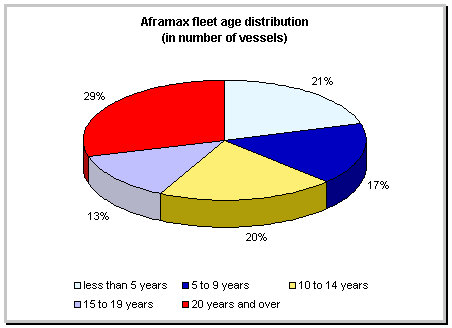
number of ships over 20 years, even 15 years, prevalent in this area has
no longer an impact on freight levels. In practice, the drastic security
measures taken both by governments as well as oil companies ensures that
only units less than 15 years reflect a true value of this market.
The diversity of movements and the large number of intervening
charterers operating in the Mediterranean are supplementary reasons for
the healthy level of rates in this market.
In the current climate of low freight levels, owners of older vessels
must choose between waiting longer and longer between fixing, going off
to join the ever expanding numbers of such ships in the East, or sending
them voluntarily for demolition.
|
|
Shipping and Shipbuilding Markets in 2001
I N D E X
|