The Reefership market
in 2000
|
|
|
| |
| Market context and trends |

|
|
The 1999-2000
season was even worse than owners / operators had envisaged, after an
already disastrous 1998-1999. Not only was the highest level of the
season well below that of the previous year, but it also did not last
nearly as long. Only a better beginning to the period and the
maintaining of freight levels allowed for average spot rates slightly
inferior to last year's. Contracts were renewed also at levels
slightly below the previous period, while "spot" levels were
on average 2.5 % lower. The season was therefore extremely short, and
the market had already collapsed by the beginning of April. 12-month
charter business was once again limited, and rates were weak. A
continuing preference was shown for the larger vessels over the
medium-sized ones. Against expectations, the pace of scrappings slowed
down considerably, and the units withdrawn from the fleet did just
exceed newbuildings, thanks to their limited numbers. Many of the owners
and operators faced serious financial difficulties and continue to do so
at year's end. We can mention : Amer Reefer, Enterprises,
International Reefer Services, Nomadic, Swan Reefer and the close down
of Reefer Express Lines.
During the 2000 campaign, climatic events again
strongly upset the export outlook in certain regions of the world,
notably the heavy rains in South Africa at end December, brought about a
50 % reduction in the exports of grapes against forecasts, but also
Chilean exports were about 5 % below the previous season.
Despite a favourable global economic context and an
increase in world trade, the market remained depressed due mainly to the
fierce competition from the containerships, the strength of the dollar
and the weakness of the Euro, as well as the higher bunker prices.
Chile is a typical example, with exports to Europe
down by nearly 50 %, and although some of this trade switched to the
U.S., the difference in vessel utilisation time is considerable, with a
30 % less voyage time.
There were some significant events occurring on the market in 2000:
- January 2000: a "coup d''tat" in Ecuador with the
president Jamil Mahaud replaced peacefully by his vice-president
Gustavo Noboa. The policy of his predecessor, and notably the
"dollarisation" still remains in force.
- March 2000: the Bourgoin group declared bankruptcy. There has been a
splitting-up of the company, and a part of the business has been taken
up by several food co-operatives in October.
- Throughout the year, numerous versions of the preferential banana
import policy into the E.U. were submitted by the Brussels Commission,
but without success. It seems for the moment impossible to find a
system which can satisfy at the same time the World Trade Office, the
U.S., the banana multinationals, the "banana-dollar"
producers, and the A.C.P. producers.
- December 2000: Hoegh sells Cool Carriers to Lauritzen for a reported
price of around US$35.4 million. The new entity goes by the name of
Lauritzen Cool AB, and will begin operating under its new colours on
January 1st 2001. The head-office is in Stockholm, but the Arctic
Reefers pool will be operated out of Copenhagen. This transfer only
applies to the commercial operations of Cool Carriers, and the Hoegh
shipping assets are not affected. With about 90 vessels having a
refrigerated capacity in holds of roughly 52 million cubic feet, and
an important container capacity on deck, Lauritzen Cool has become the
largest operator of reefers over 250,000 cu ft.
- December 2000: the order of the first two reefers in over two years.
(see Newbuildings, below)
|
| Contracts
|

|
|
Vegetable export contracts from the Canary Islands
(covering the period November 1999-May 2000), which are traditionally
renewed in mid-July, were concluded at the beginning of July 1999 at
freight levels around 5-10 % below the previous year (which themselves
were 20 % lower than the July 1997 rates). Eight vessels should cover
the transport of about 400,000 pallets to Northern Europe. In addition
some 30,000 pallets will be moved for the first time' in containers.
New-Zealanders negotiated terms in November 1999
slightly below the previous year, with adjustment clauses. South African
fruit exporters as well got reduced rates, as was also the case for
Chilean fruit exporters.
|
| The spot market
|

|
|
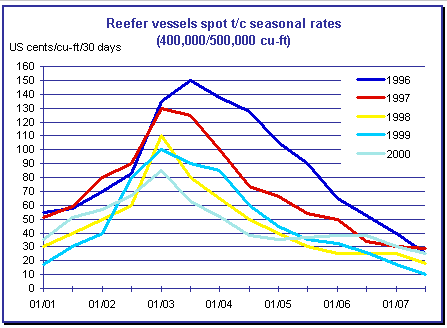
As already mentioned, the average freight levels on
the spot market in 2000 were again disappointing for owners and
operators, with an average reduction of some 2.5 %. Starting from a
level well above 1999, rates did not take off, but saw a steady
progression up until March, then fell almost in a straight line until
the beginning of May. They then levelled off, and even rose very
slightly, maintaining a summer level less catastrophic than the previous
year.
Spot rates were around 35 cents in the beginning of
January (17 in 1999), and at mid-January reached 51 cents. By the
beginning of February for modern vessels of 400-500,000 cu ft they rose
to nearly 57 cents per cu ft/month (40 in 1999), but only 67 cents in
mid-February (80 in 1999), and for a short time "peaked" at
beginning of March at 85 cents, as compared to US$ 1.00 in 1999. Then,
they dropped much more quickly than last year, reaching 62.5 cents by
mid-March (90 in 1999), 52 cents in early April (85 in 1999), and a
level of 35 cents early May (45 in 1999). After mid-May, there was a
totally different configuration in levels as compared to last year, with
prices holding up whereas they had steadily fallen to reach a bottom in
the summer of 1999. They were at 38.5 cents early June (32.5 in 1999),
38 mid-July (26 in 1999), from where they then slipped to 30 cents early
July (17.5 in 1999), and reached 25 cents in mid-July (10 in 1999). One
has to go back to 1997 to find such a high level.
Summer rates fell to an average 20 cents cu ft/month.
This movement in the rates can be quickly summarised as follows:
- A good tonnage demand at the beginning of the year in the Ecuador
/ St. Petersburg route.
- South African exports being halved in February / March.
- An overall reduction in Chilean exports, with 50 % less going to
Europe.
- A quiet export situation in Morocco.
- In May and June, increased activity in South Africa, Argentina,
New Zealand, and additional cargoes exported from Morocco (May).
Even modern tonnage had difficulty in finding
employment in the summer period. A number of them were forced into
lay-up, as were the older vessels. By the end of July there were more
than 100 vessels in this situation, nearly 40 million cu ft, an
identical figure to 1999. Given the weakness in rates, lay-up started to
occur this year as from mid-April. Traditionally, the garlic shipments
from China gave work to some vessels, but cargoes of cars from Japan
were at lower levels than last year. Moreover, a record number of
specialised car carriers were delivered (34 coming into service in 2000,
of which 25 in the period January to August, following the 33 vessels
delivered in 1999). 
|
| Time-charters |

|
|
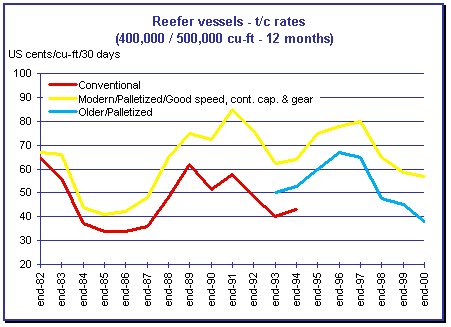
The time-charter market slipped again this year, but
to a limited extent. For modern vessels, the drop was around 2.5 %
(following decreases of 10 % in 1999, and 20 % in 1998). Considering the
low levels reached already in 1999, a further plunge was unlikely. It is
worth pointing out that there are very few time-charter ships being
concluded, with charterers preferring to play the spot market to take
advantage of the weak rates.
In the 400-550,000 cu ft size, there is an increasing
gap between levels being obtained by modern and older vessels. For
12-month periods, modern, fast, palletised vessels with good container
capacity, and well-geared, obtained rates of around 57 cents cu
ft./month (58.5 in 1999), whereas first-generation palletised or
converted conventional ships were being fixed at 38 cents (as compared
to 45 in 1999).
The 260-300,000 cu ft category were also affected by
the decline in the market. 12-month rates averaged around 55 cents cu
ft/month (60 in 1999), a drop of 8.5 % over last year.

|
Shipping and Shipbuilding Markets in 2000
I N D E X
|