The geographical breakdown in orders remains relatively constant, whereas
the majority of the increase seen last year went to Korea.
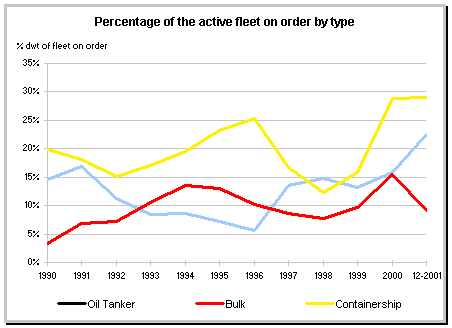
However the breakdown in ships' types has changed. In 2000 the three
principal newbuilding cycles, that of tankers, bulk carriers, and
containerships, followed the same pattern as illustrated in the graph of
'Percentages of ships on order over existing fleet'.

This graph illustrates that the dry bulk carrier and containership
cycles started a little earlier (early 1998) than that of tankers (early
1999) and hit their historic highs at the start of 2001 with respectively
16 % for dry bulk carriers and significantly more for containerships with
28 %. The bend in these two curves right from the start of 2001 indicated
already a certain apprehension and a real reduction in the orders for dry
bulk carriers and containerships. Tonnage of dry bulk carriers on order
declined from 39.5 to 25.2 million dwt and that of containerships remained
around 21 million dwt.
The orderbook for tankers continued to rise to reach a figure of 22 %
of the existing fleet thus surpassing the previous historic record of 17 %
in 1991. The tonnage of tankers on order increased in 2001 and went from
46.1 to 64.6 million dwt. This prolongation of the tanker cycle applies
particularly to the categories between 35,000 and 120,000 dwt.
Specialised tonnage, with the exception of LNG carriers, has seen new
orders declining considerably.
Cruise ship operators which made massive investments in 1999 and to a
lesser extent in 2000, only made a single new order in 2001.
The LNG carriers orderbook rose from 824,000 cbm in 1999 to 2,485,000
cbm in 2000 then to 4,026,700 cbm in 2001, nearly 50 % of the existing
fleet. A number of these orders are speculative and driven by the
prospects of a rapid development in this energy source.