|
|
|
Signs of
improvement without real conviction
|
| |
| Market context
and trends |
|
|
|
Despite the end of the year 2000 being
extremely active, the beginning of 2001 was strangely calm and the start
of the high season was delayed to early March.
Some sixty ships were brought out of lay up too early at the start of
the year whereas demand mainly from Chile and Equador was not strong
enough to be able to absorb such a sudden supply of tonnage.
Spot rates remained depressed until the end of February with the market
falling victim to poor weather conditions in Central America and
Argentina. In early March the combined demand of the southern hemisphere
fruit exporters pushed up the market, but without ever going over 90 to 95
cents for modern ships of 500,000 cu ft and having good container capacity
on deck.
The dollar's strength relative to the euro helped Chilean fruit
exporters into the United States, but with the ships' rotation being
much shorter, the reduced exports to Europe had a negative effect in terms
of tonnes-miles and the number of ships chartered.
Generally owners experienced a high season comparable to the previous
year, while the period from May to the end of the year was far better in
2001 and more promising for 2002.
As from mid-June more than 80 ships were laid up and some ten were sold
to scrap. Russia now plays an ever increasing role in the spot market, as
it not only regularly imports bananas but also a number of other fruit
from the southern hemisphere throughout the year (nearly 1.5 million tons
of apples, pears, and citrus fruit).
We have seen again this year that the spread in rates between the high
and low seasons is tending to narrow and that container utilisation during
the high season is able to cover peak demand without having to go onto the
spot market too often.
In the standard palletised ship's size of 380,000 / 420,000 cu ft,
the Canary contracts were signed in July for time charter periods from
November to early May between 70 and 76 cents, namely 5 % more on average
than the previous season (a total of eight ships).
Owners, who did not lay-up their ships too early, were often able to
fix them in the summer at better rates than in the autumn. Time charter
rates reported for conventional palletised ships of 450,000 / 500,000 cu
ft averaged 32.5 cents in June, 23.5 in August and September, to fall to
19.5 cents in October before rising to 35 cents in November.
July and August which are historically the most difficult months for
owners saw a healthy activity thanks to the export of citrus fruit from
South Africa and South America towards Europe and Asia, on one hand, and a
recovery of banana prices in the U.S. and Europe on the other.
In the last quarter the most noteworthy improvement was seen for small
sizes at the start of the citrus season from Morocco to Scandinavia,
Russia, and the northern Continent. Rates jumped from 45 cents for
palletised ships of 2,000 / 2,200 pallets to more than 70 cents in few
weeks. This was partly due to the fact that Moroccan owners decided not to
reactivate their old ships but to put them up for sale and also to work
the citrus cargoes on a spot basis.
As to the needs of the Major banana producers we have seen again that
chartering decisions to cover their 2002 contracts were taken late in the
day and especially that the number of ships chartered for a 12 month
period is declining. Only some 15 ships of about 500,000 cu ft, 21 knots,
100 feus, fitted with 36 / 40 tons cranes, were chartered at about 63 / 65
cents for the more modern ones and 55 / 57 for ships of over 10 years,
which corresponds to an increase of about 5 % compared to last year.
|
|
| Significant
events |
|
Owners consolidation
After the takeover of Cool Carriers by Lauritzen and the setting-up of
Lauritzen-Cool end 2000, Swan Reefers bought Star Reefers as a first step,
and then joined forces with NYK to form a new pool NYK-Star Reefers, which
controls 72 ships between 393,000 and 670,000 cu ft.
Hamburg-S'd who had been a partner in Star Reefers left the pool and
four of their eight ships went to join the Leonina pool of Lauritzen-Cool,
while the remaining four stayed on with NYK-Star for another year.
The Dutch owner Vroon b.v. with 10 ships joined the Sun Group and three
other owners, to form the United Reefers pool and has shown an interest in
the Amer Shipping fleet (a member of the Leonina pool) which was put under
court order in mid-March in the U.S. Vroon is trying to take control by
buying a majority share with an American investment fund. United Reefers
regroups five owners and controls a fleet of 24 ships of 185,000 to
535,000 cu ft.
Seatrade and Nissui Shipping have joined together in the Pacific for
small size ships, creating Tokyo Reefer chartering, a mini pool which
controls 15 ships.
In May a new Japanese company, Fresh Carriers Company (FCC) took over
the management of Nissui's big ships chartered to Dole and on other
fruit contracts.
We should also mention the start-up of a new container service
Australia / New Zealand to West and East Coast U.S. by Maersk-Sealand. One
of the first clients of this new service was the NZ Dairy Board who
represents on its own 360,000 tons for U.S. destination.
|
Fruit producing countries
With effect from October 1st 2001 in New Zealand, Enza no longer had
the monopoly of apple transport and exports and thus had to face other
organisations which have stepped forward. Exports of kiwis from the
southern hemisphere have remained stable (about 92 million trays), with an
increase in Chilean production compensating for the drop in New Zealand's.
This fruit is facing increased competition from southern Europe producers
like Italy and France who now supply their own markets.
An agreement to finally end the banana dispute was reached in April
between OMC and the EU. New regulations should come into force from
December 31 2001, to allow the U.S. to lift their sanctions. In the first
stage the system of import licences will continue up until 2006 and will
be calculated on the basis of historical data with a reference period of
1994 to 1996 which should favour a group like Chiquita much more than Dole
or Fyffes. The quota for the ACP countries will be reduced by 100,000
tons, which Europe will import from Ecuador or Central America with 83 %
of licences being allocated to traditional importers. With effect from
2006 imports of bananas will be based on tariffs according to the country
of origin.
At the end of August after a week of intense conflict, the strike of
Ecuadorian banana producers ended with the creation of a fund guaranteeing
a production price.
The production of Argentinean apples and pears exceeded two million
tons of which 488,000 tons were exported, and citrus fruit production
reached 2.63 million tons. Export levels have increased towards Europe and
Russia, and the U.S. has re-opened its market to citrus fruit.
Banana production in Honduras has regained its exports volumes before
hurricane Mitch.
A significant reduction in banana's produced in Costa Rica and
Equador was felt at the beginning of the year due to climatic conditions,
which meant that finally the price levels improved in the North American
and European markets, after a long crisis period due essentially to an
overproduction rather than a drop in demand.
In Morocco following a long dry spell, exports of citrus fruit and
potatoes were some 30 % lower or roughly 360,000 tons.
The Spanish clementine campaign into the United-States was highly
satisfactory (some 80,000 tons from November to February). However this
year the campaign came to a sudden halt in December with the discovery of
a dead fly in a cardboard box (with some 35,000 pallets in transit and on
board ships in mid-December 2001).
In South Africa, citrus fruit production was about 1.5 million tons of
which 800,000 tons exported mainly to Europe. The rand devaluation help
stimulate exports, which also took advantage of the drop in Spanish
production.
Apple harvests in Italy and France suffered a 10 % drop after the
spring frosts and some 20 % in the state of Washington (USA).
|
| The fleet |
|
|
|
The world reefer fleet has reduced further
this year. As of December 31st 2001, it comprised 1,237 ships over 40,000
cu ft, with a total capacity of about 349 million cu ft, namely a drop of
0.96 % in the number of ships, and 1.13 % in capacity compared to December
31st 2000.
Deliveries of newbuildings has again dropped considerably; four ships
with about 1.3 million cu ft were delivered in 2001, against 13 with about
6.3 million cubic feet in 2000. They are the lowest figures seen since
1959.
Only three new units will be delivered in 2002, representing a total
capacity of some 1.2 million cu ft.
It is surprising to find that despite the market weakness, the pace of
ships being withdrawn (scrapped or for other reasons like total loss or
conversion) has noticeably slowed down in number with only 16 ships being
demolished (as against 27 in 2000), which goes against logic. In terms of
capacity the volume dropped in the same proportional order, with the 16
ships totalling 5.3 million cu ft (compared to 9.5 million cu ft in 2000).
The figures given above are based on the refrigerated capacity in the
reefer ship's hold. They should be interpreted by taking into account
the increased capacity of refrigerated containers on delivered new units,
both on reefer ships as well as containerships.
In practice we have seen in 2001 an increase of about 134 million cu ft
in global refrigerated capacity, equal to nearly a third of the total
capacity of refrigerated fleet.
Theoretically, the orderbook of containerships makes it possible to
envisage the
|
| Conclusion and
outlook |
|
|
|
At the risk of repeating ourselves year after
year, the same causes (the competition with containers and a surplus
capacity) produce the same effects, and there is little chance of seeing
the market recover in the short term.
The majority of analysts are in agreement that for any hope of a
lasting improvement in the reefer market a roughly hundred ships of over
300,000 cu ft should be scrapped. At the start of 2002, 35 ships of over
300,000 cu ft will be between 25 and 29 years old and 21 ships will be
over 30 years, representing a total of 56 ships and in volume about 10 %
of the fleet of over 300,000 cubic feet, out of 505 ships in total in this
segment.
The reversal in the containership market which reached historic lows at
the end of the year 2001 for most sizes, further aggravates the
competition within the perishable goods traffic. Aware of this risk, the
large operators of reefers are developing regular parcel services and are
getting established in places like South Africa, South America and New
Zealand where the various export groups are more dispersed.
Even if transport by container is an operation requiring considerable
investment and requires on average a minimum of three sets of refrigerated
containers units to assure a regular service, it is disturbing to see
coming onto the market this year 200 new containerships with a theoretical
capacity of 80,700 reefer plugs compared to 144 ships with 47,000 plugs
delivered in 2000.
Today we can see that orders for refrigerated ships are virtually nil,
as the return on investment in this market over the last five years has
been minimal if anything at all. Owners have reacted by reducing their
overheads and in laying-up their ships for part of the year, but often at
the cost of good regular maintenance.
However nothing can replace in terms of quality of transport the
specialised ships of the last generation which offer unbeatable
transit-times, the possibilities of additional spaces for containers on
deck, and a great operating flexibility.
No doubt the big container operators will try to increase their share
of the market in sectors where product can be conditioned and packaged in
small quantities, but the traditional owners of reefers should be able to
compete on base products transported in big volumes such as bananas and
other everyday fruits. However, in order to meet this challenge, the
market should give them the means.
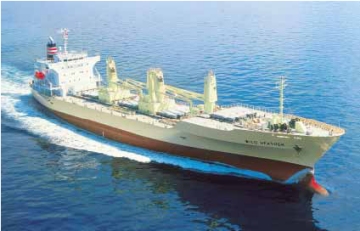 |
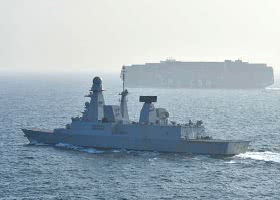
Wild Heather
499,793 cu ft, 58 feu, 58 plugs, 25 kn, 10,144 dwt, blt in 1998 by Iwagi
Zosen, operated by NYK-Star Reefers |
|
Shipping and Shipbuilding Markets in 2001
I N D E X
|