The Shipbuilding
Market in 1998
1998 was marked by several trends.
1. A slump of about 15 to 30% in the sale
prices of most standard ships, depending on their type and their size, but also on the
degree of competition between shipyards. The specialized tonnage was also affected by this
fall in prices, but in a more diffuse manner, with the notable exception of
cruiseships.
2. Further growth in the world orderbook for newbuilding ships, which
increased from 56.6 million gt to 57.7 million gt between the end of 1997 and the third
quarter of 1998, its highest level since 1976, despite the gradually spreading economic
crisis, a reduction in the growth of world trade and the greater difficulty in financing
such investments.
This led to a significant reduction in the volume of orders compared
with the previous year, for all types of ship except containerships, LPG carriers, ro-ro
ships and cruiseships, while forecasts of world growth and international trade in 1999
have been continuously revised downward.
3. Consolidation of the market shares of the two principal shipbuilding
countries, Japan and Korea, despite the financial crisis sweeping these countries. The key
end-of-year figures are 10/10 and 20/20: 10 million gt of orders, 20 million gt in the
orderbooks for each country. The retreat of China and a slight bounce-back by Europe
should be noted.
|
| A large reduction in the orderbook might have been
expected in 1998 as a consequence of the crisis that swept through South-East Asia in the
fall of 1997. This did not happen, and as a whole shipbuilding was once again particularly
active. In 1973 the world orderbook reached the remarkable
figure of 120 million gt. It is not impossible that the orderbook in the third quarter of
1998 was in fact an all-time record on "adjusted data". One reason is that
building a ship at that time required approximately double the time spent today (the
Swedish shipyard Kockums, reputed for its productivity, needed about one million hours to
build a VLCC which the best Asian shipyards currently produce in a little less than five
hundred thousand hours). Another reason is that many orders had been canceled following
the first oil crisis. |
World orderbook since 1990
in million of gross tonnage
|
|
South Korea |
Japan |
China |
Western Europe |
Eastern Europe |
Rest of the world |
Total |
end 1990 |
8.7 |
13.5 |
1.1 |
8.3 |
4.4 |
4.2 |
40.4 |
end 1991 |
7.8 |
14.9 |
1.4 |
9.2 |
3.8 |
3.2 |
40.3 |
end 1992 |
7.9 |
14.4 |
2.0 |
8.4 |
4.4 |
3.3 |
40.4 |
end 1993 |
8.6 |
11.1 |
2.0 |
8.1 |
4.5 |
2.1 |
36.4 |
end 1994 |
10.9 |
13.1 |
1.9 |
8.2 |
5.2 |
2.6 |
41.9 |
end 1995 |
13.9 |
13.7 |
2.0 |
8.2 |
5.9 |
2.6 |
46.1 |
end 1996 |
13.2 |
13.7 |
2.7 |
8.3 |
4.8 |
2.6 |
45.3 |
1997 (September) |
16.6 |
15.8 |
2.9 |
8.1 |
4.4 |
2.7 |
50.5 |
1997 (December) |
18.7 |
19.8 |
3.2 |
8.0 |
3.6 |
1.6 |
56.6 |
1998 (March) |
18.3 |
18.4 |
3.0 |
8.9 |
3.9 |
2.6 |
55.2 |
1998 (June) |
18.5 |
18.6 |
2.8 |
8.9 |
4.0 |
2.9 |
55.6 |
1998 (September) |
18.0 |
20.1 |
2.6 |
9.4 |
4.0 |
2.7 |
57.7 |
|
|
| Although the world orderbook has increased smoothly at a
rate of about 8% per year since 1993, while dollar prices were falling from their peak in
1991 at about 4% per year, the main explanation of the sustained activity in 1998 is the
significant fall in newbuilding prices over an extremely short period. Compared with 1991 the fall is yet more marked, while over the same period ship
specifications have become more sophisticated.
Newbuilding prices variations (in million US$ -
basis 5 x 20%) |
|
|
|
3Q1997 |
3Q1998 |
Variations 98/97 |
1991 |
Variations 98/91 |
|
|
|
|
|
|
|
|
VLCC |
82 |
70 |
-15% |
115 |
-39% |
|
Suezmax |
51 |
45 |
-14% |
65 |
-30% |
Tankers |
Aframax |
41 |
34 |
-17% |
55 |
-38% |
|
Panamax |
36 |
30 |
-17% |
|
|
|
IMO2 45k Product |
33 |
29 |
-12% |
40 |
-27% |
|
|
|
|
|
|
|
|
Capesize |
42 |
35 |
-17% |
55 |
-36% |
Bulkers |
Panamax |
27 |
20 |
-25% |
30 |
-33% |
|
Handymax |
26 |
19 |
-27% |
29 |
-34% |
|
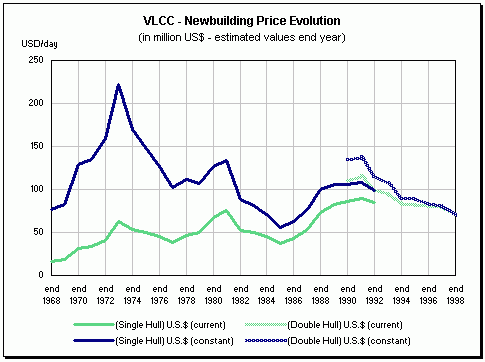
Prices reached very low levels in current dollars and, in constant
dollars (adjusted for inflation), levels below those reached during the previous
shipbuilding crisis in the mid-1980s.
Under these conditions, shipowners can justify their investment decision by being sure of
profiting from a relative advantage over their predecessors, who ordered at higher prices,
but also of buying at all-time low prices.

The Asian financial crisis certainly influenced the behavior of the
decision-makers. However, it was definitely the fall in the Korean currency with respect
to the dollar which made the very big fall in newbuilding prices and the new orders
possible in an uncertain environment.
There are no precedents of this magnitude.
Average exchange rates with US Dollar |
|
Yen |
Won |
DM |
|
1997 |
1998 |
1997 |
1998 |
1997 |
1998 |
January |
118.0 |
129.5 |
851 |
1 702 |
1.60 |
1.82 |
February |
123.0 |
126.0 |
866 |
1 627 |
1.67 |
1.84 |
March |
122.5 |
129.0 |
880 |
1 489 |
1.70 |
1.83 |
April |
125.5 |
132.0 |
894 |
1 387 |
1.71 |
1.81 |
May |
118.0 |
135.5 |
892 |
1 403 |
1.70 |
1.79 |
June |
114.0 |
140.5 |
889 |
1 395 |
1.73 |
1.79 |
July |
115.0 |
140.5 |
891 |
1 293 |
1.79 |
1.80 |
August |
118.0 |
144.5 |
897 |
1 312 |
1.84 |
1.79 |
September |
121.0 |
134.5 |
910 |
1 373 |
1.79 |
1.70 |
October |
121.0 |
121.5 |
926 |
1 336 |
1.76 |
1.64 |
November |
125.5 |
120.5 |
1 033 |
1 289 |
1.73 |
1.68 |
December |
129.5 |
117.5 |
1 501 |
1 211 |
1.78 |
1.65 |
|
|
| In 1991 the Finnish mark was devalued by about 40%. In
1992 and 1993 some South European countries (Italy, Spain, Portugal) devalued their
currencies and the shipbuilding yards increased their sales. In 1994 China also devalued
the yuan by 30% and increased its exports. However, the relative size of the shipbuilding
industry in these countries meant that the impact was only regional. The importance of Korea, which accounts for about one third of world ship
production, amplified the phenomenon and dragged Japan into a downward spiral. The slow
but continued depreciation of the yen and the anticipation by many protagonists of a still
weaker yen until the end of the summer, given Japan's persisting difficulties, also pushed
prices down.
The fall in newbuilding prices in dollars generated a speculative
downward movement.
It is tempting - and it is the simplest approach - to calculate new
prices in proportion to the changes in exchange rates. On this basis, and using an average
precrisis exchange rate of 900 won/$ and an average exchange rate of 1,300 won/$, there
should be a negative margin of about 30% between the prices charged in 1997 and those
charged in 1998. This model is not completely validated by experience.
In practice, the Korean yards must also buy many supplies in dollars or
in wons-dollars, such as the steels, the main engine and the main equipment items, even
though these can be made locally, together with specific equipment imported from Europe or
from Japan. This proportion of purchases in dollars varies from one ship to another. For a
VLCC it is about 60% in dollars and 40% in wons, giving a theoretical negative margin of
about 18%.
By pure coincidence, the fall in the price of VLCCs recorded in 1998
happens to be approximately this magnitude. However, this relationship is insufficient to
explain the larger changes recorded for other types of ship such as Panamax and Handy bulk
carriers, where the competition between Korean, Japanese and Chinese shipyards is more
intense.
Moreover, when the yen went from 80 yen/$ in April 1995 to 145 yen/$ in
August 1998, the market prices, mostly fixed in the US currency, did not decrease in
proportion (neither had they increased when the yen went from 130 yen/$ in 1991 to 80
yen/$ in 1995).
Exchange rates are therefore only one part of the equation. The cost of
raw materials and equipment, which also fell, and the higher interest rates and more
expensive imports after a devaluation must be taken into account.
However, it seems that the sudden appreciation of the yen from 145 to
111.6 yen/$ on 8 October was able to stabilize the fall in ship sale prices. An upward
trend seemed to be identifiable at the end of 1998, at least in the bulk carrier ship
market which is dominated by Japan, and this will continue in 1999 if the outlook allows.
In any case it is the market and the balance (or lack of it) between supply and demand
which will prevail in the end.
|
Orders by quarters (in million gross tonnage) |
| |
|
Japan |
South Korea |
China |
Western Europe |
1996 |
March |
2.237 |
1.176 |
0.279 |
0.890 |
|
June |
1.896 |
1.344 |
0.440 |
0.665 |
|
September |
2.660 |
1.301 |
0.270 |
0.532 |
|
December |
2.366 |
2.916 |
0.676 |
1.087 |
1997 |
March |
3.875 |
2.585 |
0.500 |
1.001 |
|
June |
2.905 |
3.728 |
0.283 |
1.129 |
|
September |
2.757 |
3.533 |
0.235 |
0.394 |
|
December |
5.824 |
3.887 |
0.443 |
0.925 |
1998 |
March |
2.238 |
1.379 |
0.245 |
1.585 |
|
June |
2.648 |
1.741 |
0.241 |
1.040 |
|
September |
3.875 |
2.801 |
0.053 |
1.085 |
% increase 1-2-3 Q 1997/98 |
-30% |
-30% |
-47% |
32% |
|
Although the orderbook grew in 1998, the overall rate of ordering
nevertheless slowed compared to 1997: it fell in Korea, Japan and China and increased in
Europe.
This fall is relative, because the volume of orders over the first three
quarters of 1998 remained high and greater than the same period in 1996, when it was
sustained.
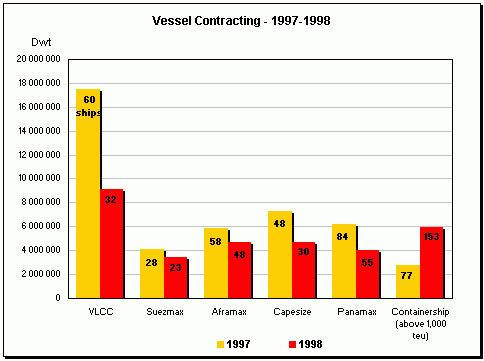
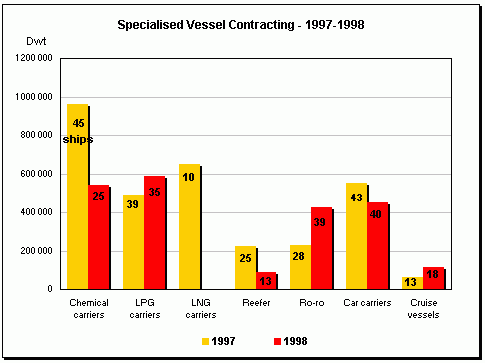
This drop in order volume affected most standard ships but also the
specialized tonnage, except for containerships, LPG carriers, ro-ro ships and car
carriers, and cruiseships.
The search for economies of scale, the competition between operators to
maintain or increase market shares and the reduction in newbuilding prices were probably
behind the new containership orders, the volume of which increased from 9% to 15% of the
total carrying capacity of the orders. The number of units ordered, which increased from
77 to 153, is a more significant indicator.
For ro-ro ships, absent from the orderbooks for many years, the need for
renewal with better-adapted and faster ships, the firmness of freight rates and of
second-hand values and the fall in newbuilding prices as a consequence of the new interest
of Asian shipbuilding yards in this type of ship increased the number of ships on order
from 28 to 39.
The increase in vehicle production capacities and the search for more
export outlets also contributed to the large number of car carriers in 1998, slightly
below the 1997 figure but substantially higher than that for 1996.
The firmness of freight rates and the development of alternative energy
sources can also explain the interest in large LPG carriers, for which the total capacity
on order increased from 646,719 cbm to 878,025 cbm.
The excellent results of the cruise companies, profiting from economic
growth in the United States and Europe, as well as the longer leisure time of the
baby-boom generation, encouraged these companies to continue investing in new
cruiseships.
However, these ships represent only a small percentage of the world
orderbook, most of which comprises tankers, bulk carriers and containerships.
1997 had inaugurated a new tanker fleet renewal cycle. This continued
through 1998, since this category's share in the world orderbook, expressed in dwt,
increased from 49% to 59%, while those of bulk carriers and containerships decreased from
29% to 24% and from 15% to 10%, respectively.
Among the tankers the VLCCs occupy a special place, because most Asian shipbuilding yards
have optimized their activities around this type of ship.
One of the challenges of the early 1990s was to deal with the renewal of
the VLCC fleet, and in particular to replace the fleet built between 1973 and 1976 and
still in service, which represents 170 ships in four years. This seems to have been
managed without difficulty. Scrapping has more or less offset deliveries over the last few
years.
Although some shipowners had declared that they wanted to extend the
life of their tankers beyond the critical age of 25 years, it seems that most of them have
reversed their initial decision under pressure from, among others, the oil companies. In
this case, VLCC deliveries in 1999 and 2000 would remain below the number of ships
scrapped, which could generate new orders in 1999. However, the slowdown in energy demand
as a consequence of the reduction in world growth could have a dampening effect. A fall in
the price per barrel below 10 dollars could make the oil companies postpone non-strategic
investment. From 2001 the rate of deliveries should fall substantially, approaching the
scrapping rate: the VLCC renewal cycle will then be partly completed, which underlines the
abundance of supply and the reactivity of the market.


|
Shipping and Shipbuilding Markets 1999
I N D E X
|