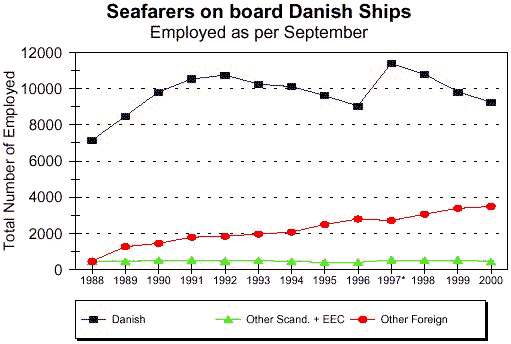
6: Employment Statistics for Seafarers etc.
| Table 6.1: Seafarers on board Danish Ships
|
| |
| As per September | Danish
| Other Scand. + EEC | Other Foreign
| Total |
| | | |
| |
| 1988 | 7,130 | 460
| 438 | 8,028 |
| 1989 | 8,467 | 439
| 1,258 | 10,164 |
| 1990 | 9,810 | 491
| 1,433 | 11,734 |
| 1991 | 10,541 | 518
| 1,775 | 12,834 |
| 1992 | 10,757 | 458
| 1,834 | 13,049 |
| 1993 | 10,256 | 480
| 1,954 | 12,690 |
| 1994 | 10,118 | 435
| 2,060 | 12,613 |
| 1995 | 9,607 | 389
| 2,472 | 12,468 |
| 1996 | 9,044 | 381
| 2,784 | 12,209 |
| 1997* | 11,391 | 515
| 2,707 | 14,613 |
| 1998 | 10,788 | 508
| 3,056 | 14,352 |
| 1999 | 9,807 | 513
| 3,381 | 13,701 |
| 2000 | 9,257 | 432
| 3,480 | 13,169 |
The Danish Maritime Complex employs approx. 45,000 persons. Approx. 22,000 are employed by
the shipping companies
*From January 1, 1997, seafarers on board passengers ships includes former public
ferry lines in the employment statistics (a total of approx. 2,000 persons)
|

|