2: Size and Composition of The Merchant Fleet
| Table 2.4: The Danish Merchant Fleet according to Types of Ships
|
| | January 1, 2000
| January 1, 2001 | October 1, 2001
|
| Types of ships | Number
of ships
| GT
(1,000) | Number
of ships
| GT
(1,000) | Number
of ships
| GT
(1,000) |
| Liner Trade |
| Container | 80 | 2,847
| 87 | 3,259 | 81
| 3,528 |
| Ro-Ro | 8 | 116
| 10 | 159 | 10
| 159 |
| Other ships in liner trade | 5
| 39 | 4 | 25 |
3 | 14 |
| Passenger ships, ferries | 76
| 414 | 72 | 389
| 70 | 452 |
| Total | 169 |
3,414 | 173 | 3,832
| 164 | 4,153 |
| | | | | | | |
| Tramp |
| Bulk-carriers | 12 | 464
| 10 | 356 | 8 |
204 |
| Reefers | 12 | 101
| 12 | 101 | 12
| 101 |
| Other dry bulk etc. | 220 |
302 | 209 | 297 |
180 | 237 |
| Total | 244 |
867 | 231 | 754
| 200 | 542 |
| | | | | | | |
| Tanker trade |
| Oil Tankers | 5 | 214
| 8 | 793 | 6 |
704 |
| Products tankers | 32 | 640
| 33 | 554 | 35
| 618 |
| Chemical tankers | 19 | 60
| 21 | 115 | 20
| 107 |
| LPG tankers | 30 | 240
| 30 | 240 | 29
| 237 |
| Total | 86 |
1,154 | 92 | 1,702
| 90 | 1,666 |
| | | | | | | |
| Special trade |
| Cable-layers | - | -
| 11 | 71 | 12 |
77 |
| Stand-by Safety vessels | 12
| 7 | 13 | 6 |
13 | 6 |
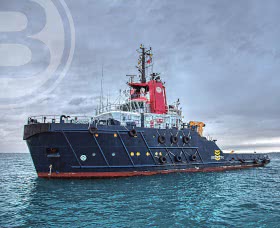
| Tug/Supply Ships | 29 | 103
| 29 | 87 | 28 |
85 |
| Tugs etc. | 41 | 27
| 41 | 27 | 43 |
28 |
| Total | 82 |
137 | 94 | 191
| 96 | 196 |
| | | | | | | |
| The total fleet | 581
| 5,572 | 590 |
6,479 | 550 | 6,557
|